
 대표어
대표어


권호기사보기
| 기사명 | 저자명 | 페이지 | 원문 | 기사목차 |
|---|
결과 내 검색
동의어 포함
title page
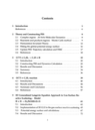
Contents
Chapter 1. Introduction 10
References 15
Chapter 2. Theory and Constructing PES 17
2.1. Complex region : Ab Initio Molecular Dynamics 17
2.2. Reactants and products regions : Monte Carlo method 18
2.3. Permutation Invariant Theory 21
2.4. Fitting the global potential energy surface 25
2.5. Update PES : Trajectory calculation and DMC 26
References 27
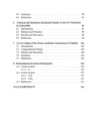
Chapter 3. C(³P) + C₂H₂ → C₃H + H 28
3.1. Introduction 29
3.2. Constructing PES and Dynamics Calculation 31
3.3. Results and Discussion 35
3.4. Summary 43
References 45
Chapter 4. O(³P) + C₃H₃reaction 48
4.1. Introduction 49
4.2. Results and Discussions 53
4.3. Summary and Conclusion 65
References 66
Chapter 5. 3D Generalized Langevin Equation Approach to Cas-Surface Reactive Scattering : Model H + H → H₂/Si(100)-(2×1) 70
5.1. Introduction 71
5.2. Implementation of 3D GLE to the gas-surface reactive scattering 74
5.3. Potential energy surface and calculations 76
5.4. Results and Discussion 81
5.5. Summary 89
References 92
Chapter 6. Classical and Quantum mechanical Studies of the CO Vibrations in CO/Cu(100) 95
6.1. Introduction 96
6.2. Method and Potential 98
6.3. Results and Discussion 99
References 108
Chapter 7. Ab Initio Study of the Trinem Antibiotic Sanfetrinem GV104326 110
7.1. Introduction 111
7.2. Computational Details 114
7.3. Results and Discussion 117
7.4. Summary 127
References 129
Appendix 132
Appendix A. Permutational Invariant Polynomials 132
A.1. 3-atom system 133
A.1.1. C₃ 133
A.2. 4-atom system 136
A.2.1. C₃H 136
A.2.2. C₂H₂ 136
References 140
국문초록(ABSTRACT) 141
Figure 2.1: The coordinate system of the reactant state. 20
Figure 3.1: Schematic energy diagram of the ³A state of the potential energy surface for the reaction of C(³P) + C₂H₂. Zero point energies are included in each state. 36
Figure 3.2: Intrinsic Reaction Coordinate at the saddle point sp34. Closed circles donate to ab initio calculation and closed squares donate to the fit-surface. 37
Figure 3.3: Reaction cross sections for collision energies of 5.0, 10.0, 20.0 30.0, and 40.0 kJmol-1.(이미지참조) 39
Figure 3.4: IRC from the complex int5 to the cyclic-C₃with H₂ channel. Closed circles donate to ab initio calculation and closed squares donate to the fit surface.... 41
Figure 3.5: Intrinsic Reaction Coordinate of the dissociative recombination reaction of cyclic-C₃H + H → cyclic-C₃(triplet) + H₂. 42
Figure 3.6: Intrinsic Reaction Coordinate of the isomerization of C₃H products. Closed circles donate to ab initio calculation and closed squares donate to the fit surface. 43
Figure 4.1: Schematic energy diagram of the ²A state of the potential energy surface for the reaction of O(³P) + propargyl. 51
Figure 4.2: The geometries of the stationary points 52
Figure 4.3: Potential energy contour plot for collinear approach of the oxygen atom to the C2υ principal axis of the propargyl radical.(이미지참조) 56
Figure 4.4: Potential energy contour plot for another collinear approach of the oxygen atom to the propargyl radical. 59
Figure 4.5: A typical reactive trajectory of a head-on collision of oxygen O(³P) with propargyl radical, C₃H₃, by direct AIMD. The solid, dashed and dotted dash lines represent ROH, RHC and ROC, respectively.(이미지참조) 61
Figure 4.6: A typical reactive trajectory for the H + propynal channel on the fitted surface. The solid, dashed and dotted dash lines represent Roc, RCH and ROH, respectively(이미지참조) 62
Figure 4.7: A trajectory on the fitted surface that starts at the global minimum and exits via unimolecular dissociation into the C₂H₃ (vinyl) + CO product channel on the fitted surface....(이미지참조) 64
Figure 5.1: The H + H → H₂/Si(100)-(2×1) reaction system. The dark colored big balls are the primary zone Si atoms and the lighter big balls are the secondary zone Si atoms in the solid.... 76
Figure 5.2: The interaction of the H-Si. The dot line represents the single Morse function with the depth well of 3.45 eV. The solid line represents the pairwise sum of the 28 H-Si Morse function with the depth well of 2.75eV. 80
Figure 5.3: The reaction probability as a function of collision energy for four different temperatures. 81
Figure 5.4: The vibrational distribution at Ts=300 K and Ei=2.O eV.(이미지참조) 82
Figure 5.5: The density of the vibrational transition and rotational transition as a function of impact parameter in the xy-plane, from the top. 83
Figure 5.6: The rotational distribution at Ts=300 K and Ei=2.0 eV. The top left for total υ, the top right for the υ=0, the bottom left for theυ=1, and the bottom right for the υ=2. 86
Figure 5.7: The motion of a typical trajectory for the head-on collision. 90
Figure 6.1: Six vibrational normal modes in CO/CU(100). The upper left and the upper right are the frustrated translation(doubly degenerated) and frustrated rotation(doubly degenerated) respectively.... 101
Figure 6.2: Two distinct normal mode pictures for the frustrated translation when three CO molecules adsorbed on the Cu(100) surface. The adsorption sites formed a triangle with three neighbor Cu atoms in the first layer.... 102
Figure 6.3: Two distinct normal mode pictures for the frustrated translation when four CO molecules adsorbed linearly on the Cu(100) surface. The upper one is a lower frequency mode and the lower one is a higher frequency mode. 105
Figure 7.1: Trinem antibiotic sanfetrinem GV104326 113
Figure 7.2: The optimized geometries, from the top 115
Figure 7.3: Total atomic charges, from the top 121
Figure 7.4: Calculated IR spectra, from the top 124
Figure 7.5: Calculated Raman spectra, from the top 125
분자의 반응을 기술하기 위해서는 포텐셜 에너지 표면(PES)을 알고 있어야 한다. 포텐셜 에너지 표면을 만드는 여러 가지 방법이 있어왔으나, 지금까지 알려진 방법으로는 5개 이상 원자를 가지는 반응 시스템을 기술하는 PES를 만들기 사실상 어려울 뿐만 아니라, 단 한 채널의 반응만을 잘 설명해줄 뿐이었다.
본 연구에서는 순 이론적 동력학 계산과 Diffusion 몬테칼로법을 기반으로 하여 Permutation Invariant Theory를 적용한 최소제곱법을 통해서 C(³P)+C₂H₂, 5-원자 반응과 O(³P)+C₃H₃, 7-원자 다원자 분자 반응에 대한 다차원 에너지 곡면을 만들었으며, 이렇게 만든 에너지 곡면은 순이론 계산 결과와 잘 일치하고 있으며 주어진 반응계에 대한 모든 stationary state를 재현하고 있을 뿐만 아니라 모든 반응채널을 잘 설명할 수 있다는 사실을 보여주고 있다. 이렇게 하여 만든 다차원 다원자 에너지 곡면을 통해 Classical Trajectory를 수행하였으며, 이를 토대로 다원자 분자반응에 대한 보다 일반적인 이론적 접근 방법을 제시하였다.*표시는 필수 입력사항입니다.
| 전화번호 |
|---|
| 기사명 | 저자명 | 페이지 | 원문 | 기사목차 |
|---|
| 번호 | 발행일자 | 권호명 | 제본정보 | 자료실 | 원문 | 신청 페이지 |
|---|
도서위치안내: / 서가번호:

우편복사 목록담기를 완료하였습니다.
*표시는 필수 입력사항입니다.
저장 되었습니다.
