
 대표어
대표어
권호기사보기
| 기사명 | 저자명 | 페이지 | 원문 | 기사목차 |
|---|
결과 내 검색
동의어 포함
표제지
목차
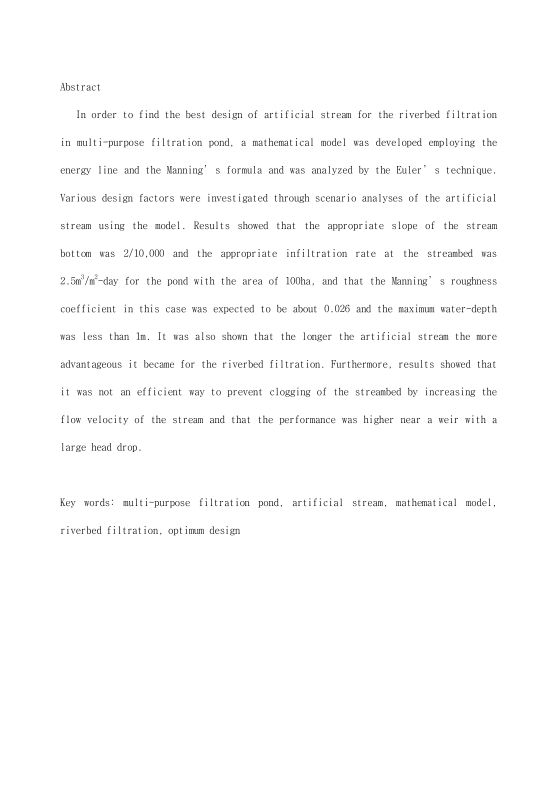
Abstract 3
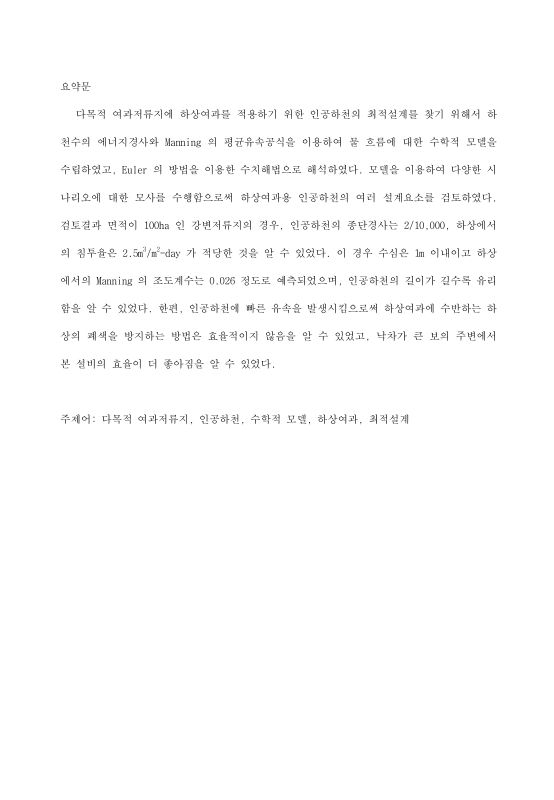
요약문 4
1. 서론 5
2. 모델전개 8
3. 모델해석 10
4. 시나리오 분석 12
5. 결론 17
참고문헌 18
Fig. 1. An example of baffle deployment to form artificial stream in multi-purpose filtration pond. 25
Fig. 2. Schematization of flow with gradually decreasing discharge in the artificial stream of a multi-purpose filtration pond. 26
Fig. 3. Change in water-depth profiles in response to the grid sizes of 10m, 100m, 500m and 1,000m(S0=1/10,000, n=0.025, q=2m³/m²-sec, Qout=1,000m³/day, L=10,000m).(이미지참조) 27
Fig. 4a. Water-depth profiles according to the bottom slope of the artificial stream of multi-purpose filtration pond(q=2m³/m²-day, n=0.025, Qout=1000m³/day, L = 10,000m).(이미지참조) 28
Fig. 4b. Velocity distributions according to the bottom slope of the artificial stream of multi-purpose filtration pond(q=2m³/m²-day, n=0.025, Qout= 1000m³/day, L=10,000m).(이미지참조) 29
Fig. 5a. Water-depth profiles according to the infiltration rate of the artificial stream of multi-purpose filtration pond(So=2/10,000, n=0.025, Qout=1,000m³/day, L=10,000m).(이미지참조) 30
Fig. 5b. Velocity distributions according to the infiltration rate of the artificial stream of multi-purpose filtration pond(So=2/10,000, n=0.025, Qout=1,000m³/day, L=10,000m).(이미지참조) 31
Fig. 6a. Water-depth profiles according to the Manning's n of the artificial stream of multi-purpose filtration pond(So=2/10,000, q=2.5m³/m²-day, Qout=1,000m³/day, L=10,000m).(이미지참조) 32
Fig. 6b. Velocity distributions according to the Manning's n of the artificial stream of multi-purpose filtration pond(So=2/10,000, q=2.5m³/m²-day, Qout=1,000m³/day, L=10,000m).(이미지참조) 33
Fig. 7a. Water-depth profiles according to the length of the artificial stream of multi-purpose filtration pond(So=2/10,000, q=2.5m³/m²-day, n=0.026, Qout=1,000m³/day).(이미지참조) 34
Fig. 7b. Velocity distributions according to the length of the artificial stream of multi-purpose filtration pond(So=2/10,000, q=2.5m³/m²-day, n=0.026, Qout=1,000m³/day).(이미지참조) 35
Fig. 8a. Water-depth profiles according to the flow rate at the end of the artificial stream of multi-purpose filtration pond(So=2/10,000, q=2.5m³/m²-day, n=0.026, L=10,000m).(이미지참조) 36
Fig. 8b. Velocity distributions according to the flow rate at the end of the artificial stream of multi-purpose filtration pond(So=2/10,000, q=2.5m³/m²-day, n=0.026, L=10,000m).(이미지참조) 37
*표시는 필수 입력사항입니다.
| 전화번호 |
|---|
| 기사명 | 저자명 | 페이지 | 원문 | 기사목차 |
|---|
| 번호 | 발행일자 | 권호명 | 제본정보 | 자료실 | 원문 | 신청 페이지 |
|---|
도서위치안내: / 서가번호:

우편복사 목록담기를 완료하였습니다.
*표시는 필수 입력사항입니다.
저장 되었습니다.
