
 대표어
대표어
권호기사보기
| 기사명 | 저자명 | 페이지 | 원문 | 기사목차 |
|---|
결과 내 검색
동의어 포함
표제지
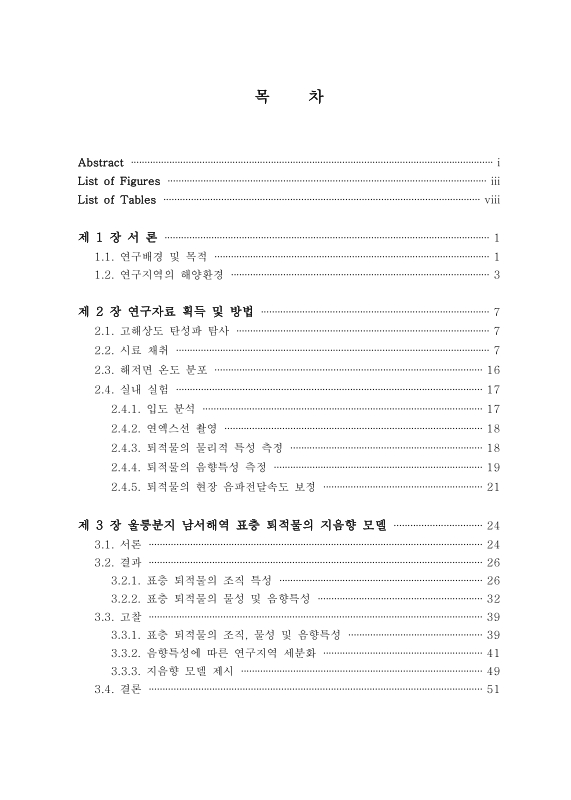
목차
Abstract 6
제1장 서론 14
1.1. 연구배경 및 목적 14
1.2. 연구지역의 해양환경 16
제2장 연구자료 획득 및 방법 20
2.1. 고해상도 탄성파 탐사 20
2.2. 시료 채취 20
2.3. 해저면 온도 분포 29
2.4. 실내 실험 30
2.4.1. 입도 분석 30
2.4.2. 연엑스선 촬영 31
2.4.3. 퇴적물의 물리적 특성 측정 31
2.4.4. 퇴적물의 음향특성 측정 32
2.4.5. 퇴적물의 현장 음파전달속도 보정 34
제3장 울릉분지 남서해역 표층 퇴적물의 지음향 모델 37
3.1. 서론 37
3.2. 결과 39
3.2.1. 표층 퇴적물의 조직 특성 39
3.2.2. 표층 퇴적물의 물성 및 음향특성 45
3.3. 고찰 52
3.3.1. 표층 퇴적물의 조직, 물성 및 음향특성 52
3.3.2. 음향특성에 따른 연구지역 세분화 54
3.3.3. 지음향 모델 제시 62
3.4. 결론 64
제4장 울릉분지 남서해역 표층 퇴적물의 물성간의 상관관계 65
4.1. 서론 65
4.2. 결과 및 고찰 66
4.2.1. 각 물성간의 상관관계 66
4.3. 결론 77
제5장 울릉분지 남서해역 천부퇴적물의 퇴적환경 78
5.1. 서론 78
5.2. 결과 80
5.2.1. 퇴적층서 발달특성 80
5.2.2. 퇴적물의 조직, 물성 및 음향특성 84
5.3. 고찰 115
5.3.1. 울릉분지 남서해역의 퇴적환경 115
5.3.2. 탄성파 특성과 지음향 구역의 비교 120
5.4. 결론 124
제6장 종합결론 126
참고문헌 128
요약 139
Appendix 143
Fig. 1-1. Map of the southwestern part of Ulleung Basin (Submarine topographic map from Korea Hydrographic and Oceanographic Administration) 17
Fig. 1-2. Schematic map of the regional circulation around the Korea Peninsula (modified after Zheng and Klemas, 1982) 18
Fig. 1-3. Distribution of surface sediment types (modified after Choi and Park, 1993) 19
Fig. 2-1. High-resolution seismic track lines of the study area. Datasource is indicated in the legend. Thick lines show interpreted seismic section in the denoted figures 21
Fig. 2-2. Location of core samples acquired in the study area 22
Fig. 2-3. Location of CTD stations. Circles indicate the CTD stations received by KIOST. Stars mean the CTD stations obtained by NFRDI. Squares represent the CTD stations received by professor Lee. Triangles... 29
Fig. 2-4. Schematic diagram of automated velocity measurement technique 33
Fig. 2-5. Temperature (℃) distribution at seafloor 35
Fig. 2-6. Bathymetry and schematic circulation pattern of the Korea Straitand neighboring sea. TWC and KSBCW denote the Tsushima WarmCurrent and the Korea Strait bottom cold water. Depths are in meters (modified after Cho and Kim, 2000) 36
Fig. 3-1. Mean grain size (Φ) distribution in surficial sediments 40
Fig. 3-2. Sand content (%) distribution in surficial sediments 41
Fig. 3-3. Silt content (%) distribution in surficial sediments 43
Fig. 3-4. Clay content (%) distribution in surficial sediments 44
Fig. 3-5. Porosity (%) distribution in surficial sediments 46
Fig. 3-6. Water content (%) distribution in surficial sediments 47
Fig. 3-7. Bulk density (g/cm³) distribution in surficial sediments 48
Fig. 3-8. Laboratory velocity (m/s) distribution in surficial sediments 50
Fig. 3-9. In situ velocity (m/s) distribution in surficial sedimentscorrected by temperature effects using Kim et al. (2004)'s averagevalue of fluid mud 51
Fig. 3-10. Geoacoustic provinces (I, II, III, and IV) of study area basedon the laboratory velocity data 55
Fig. 3-11. Geoacoustic provinces (IA, IB, II, III and IV) of study area based on the in situ velocity data determined under ambient condition. 59
Fig. 4-1. Velocity (m/s) vs. porosity (%) using geoacoustic provincesbased on laboratory velocity data. Hamilton (1970)'s data are plotted simultaneously 67
Fig. 4-2. Velocity (m/s) vs. porosity (%) using geoacoustic provincesbased on in situ velocity data. Hamilton (1970)'s data are plotted simultaneously 69
Fig. 4-3. Velocity (m/s) vs. bulk density (g/㎤) using geoacoustic provinces based on in situ velocity data. Hamilton (1970)' data are plotted simultaneously 70
Fig. 4-4. Velocity (m/s) vs. mean grain size (Φ) using geoacoustic provinces based on in situ velocity data. Hamilton (1970)'s data are plotted simultaneously 72
Fig. 4-5. Velocity (m/s) vs. clay content (%) using geoacoustic provinces based on in situ velocity data. Hamilton (1970)'s data are plotted simultaneously 73
Fig. 4-6. Porosity (%) vs. mean grain size (Φ) using geoacoustic provinces based on in situ velocity data. Hamilton (1970)'s data are plotted simultaneously 75
Fig. 4-7. Bulk density (g/cm³) vs. Mean grain size (Φ) using geoacoustic provinces based on in situ velocity data. Hamilton (1970)'s data are plotted simultaneously 76
Fig. 5-1. High-resolution chirp profile (Line 11) and line drawing showing three seismic units (Unit A1, Unit A2, and Unit B). Track lines are indicated in the Figure 2-1 81
Fig. 5-2. High-resolution chirp profile (Line 12) showing Unit A1 andUnit A2. Track lines and core locations are indicated in the Figures 2-1 and 2-2 82
Fig. 5-3. High-resolution chirp profile (Line 09) showing Unit A1 and Unit B. Track lines and core locations are indicated in the Figures 2-1 and 2-2 82
Fig. 5-4. Vertical description and X-ray images of the cores in the inner shelf. Circles indicate burrow holes. BM: bioturbated mud; HM: homogeneous mud; MS: massive sand 85
Fig. 5-5. Vertical description and X-ray images of the cores in the outer shelf. MS: massive sand; BSM: bioturbated sandy mud; BMS: bioturbated massive sand; BM: bioturbated mud 87
Fig. 5-6. Vertical description and X-ray images of the cores on the boundary of inner shelf and outer shelf. BM: bioturbated mud; BS: bioturbated sand; BSM: bioturbated sandy mud; MS: massive sand; BMS: bioturbated massive sand 89
Fig. 5-7. Vertical description and X-ray images or photograph of the cores in the slope of Ulleung Basin. BM: bioturbated mud; SL: sand layer; TL: tephra layer; HM: homogeneous mud; LM: laminated mud 91
Fig. 5-8. Profiles of physical and acoustic properties and texture of 10MAP-P53 in the inner shelf 93
Fig. 5-9. Profiles of physical and acoustic properties and texture of 11MAP-PP01 in the inner shelf 94
Fig. 5-10. Profiles of physical and acoustic properties and texture of ULSAN in the inner shelf 96
Fig. 5-11. Profiles of physical and acoustic properties and texture of 10MAP-P29 in the outer shelf 98
Fig. 5-12. Profiles of physical and acoustic properties and texture of 10MAP-P30 in the outer shelf 99
Fig. 5-13. Profiles of physical and acoustic properties and texture of 10MAP-P50 in the outer shelf 100
Fig. 5-14. Profiles of physical and acoustic properties and texture of 11MAP-PP07 on the boundary of inner shelf and outer shelf 102
Fig. 5-15. Profiles of physical and acoustic properties and texture of 10MAP-P22 on the boundary of inner shelf and outer shelf 104
Fig. 5-16. Profiles of physical and acoustic properties and texture of 10MAP-P23 on the boundary of inner shelf and outer shelf 105
Fig. 5-17. Profiles of physical and acoustic properties and texture of 10MAP-P51 on the boundary of inner shelf and outer shelf 107
Fig. 5-18. Profiles of physical and acoustic properties and texture of 10MAP-P52A on the boundary of inner shelf and outer shelf 108
Fig. 5-19. Profiles of physical and acoustic properties and texture of 11MAP-PP02 on the boundary of inner shelf and outer shelf 109
Fig. 5-20. Profiles of physical and acoustic properties and texture of 10MAP-P58 in the slope of the Ulleung Basin 111
Fig. 5-21. Profiles of physical and acoustic properties and texture of 10MAP-P66 in the slope of the Ulleung Basin 113
Fig. 5-22. Sea-level curves in the Korea Strait during the late Quaternary (modified after Suk, 1989; Min, 1994) 116
Fig. 5-23. Comparison of geoacoustic provinces (IA, IB, II, III and IV) and seismic units (Unit A1, Unit A2, Unit B and pre-Holocene deposit) using piston core data 121
Fig. 5-24. Regional distribution of sedimentary facies in the Korea Strait. I: mud or mud-sand mixed facies in the inner shelf; II: gravelly sand or sand facies in the trough; III: gravelly sand or muddy sand facies in the trough; IV: sandy mud facies in the northeastern part of the mid-shelf (modified after Park and Yoo... 122
*표시는 필수 입력사항입니다.
| 전화번호 |
|---|
| 기사명 | 저자명 | 페이지 | 원문 | 기사목차 |
|---|
| 번호 | 발행일자 | 권호명 | 제본정보 | 자료실 | 원문 | 신청 페이지 |
|---|
도서위치안내: / 서가번호:

우편복사 목록담기를 완료하였습니다.
*표시는 필수 입력사항입니다.
저장 되었습니다.
