
 대표어
대표어


권호기사보기
| 기사명 | 저자명 | 페이지 | 원문 | 기사목차 |
|---|
결과 내 검색
동의어 포함
목차
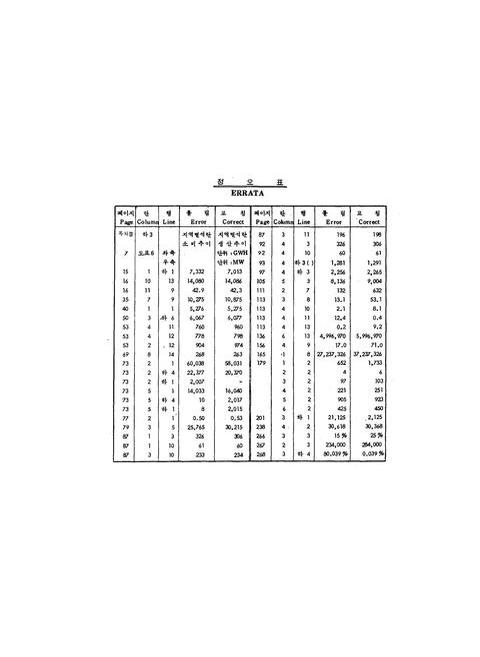
정오표=0,1,1
[표제지 등]=0,2,2
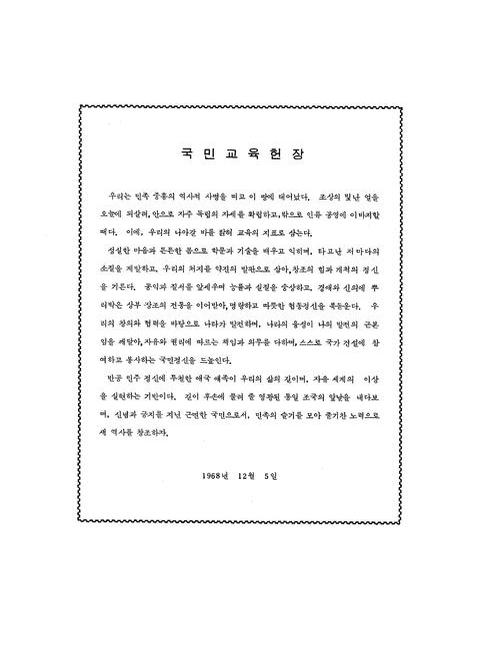
국민교육헌장=0,4,1
발간사=0,5,1
편찬사=0,6,1
이용자를 위한 참고사항=0,7,1
총목차=0,8,1
통계표목차=I,9,5
통계도표=2,14,7
I. 총에너지=9,21,3
1. 주요에너지지표=12,24,2
2. 1차에너지원별소비실적 (실물량)=14,26,2
3. 1차에너지원별소비구성 (유류환산)=16,28,2
4. 에너지 공급원별 소비구조=18,30,2
5. 에너지 수출입실적=20,32,2
6. 최종에너지 소비실적 (실물량)=22,34,2
7. 최종에너지 소비구성 (유류환산)=24,36,2
8. 부문별 에너지소비실적 (실물량)=26,38,8
9. 부문별 에너지소비실적 (석유환산)=34,46,9
II. 석유류=43,55,3
1. 석유류 수급추이 (총괄)=46,58,2
2. 석유류 제품별 생산실적=48,60,2
3. 석유류 제품의 국내 소비실적=50,62,2
4. 석유류 제품별 수출실적=52,64,2
5. 석유류 제품별 수입실적=54,66,2
6. 석유류 제품별 및 용도별 소비실적=56,68,12
7. 산업부문별 석유제품 소비실적=68,80,6
8. 산유국별 원유 도입실적=74,86,2
9. 원유도입 단가 변동추이=76,88,2
10. 원유처리 현황=78,90,1
11. 도시가스 수급실적=79,91,1
12. 석유류 제품가격의 변동추이=80,92,3
III. 석탄류=83,95,3
1. 무연탄 수급실적=86,98,2
2. 광업소별 무연탄 생산실적=88,100,4
3. 산업부문별 무연탄 소비실적=92,104,2
4. 계절별 무연탄 소비실적=94,106,2
5. 시도별 민수용 무연탄 소비실적=96,108,2
6. 연도별 저탄현황=98,110,1
7. 무연탄 수입실적=99,111,1
8. 무연탄 수송현황=100,112,2
9. 국내탄광 현황=102,114,1
10. 탄전별 무연탄 매장량=103,115,1
11. 사업별 석탄광업육성자금 지원실적=104,116,4
12. 석탄개발 조성자금 융자현황=108,120,2
13. 광산 재해 현황=110,122,2
14. 출탄 100만톤당 재해현황=112,124,2
15. 무연탄 및 연탄가격 변동추이=114,126,2
16. 유연탄 수급추이=116,128,1
17. 전국 연탄공장 현황=117,129,2
IV. 전력=119,131,3
1. 전력종합추이=122,134,4
2. 발전설비 추이=126,138,2
3. 발전소별 설비추이=128,140,6
4. 송전설비 추이=134,146,2
5. 변전설비 추이=136,148,2
6. 배전설비 추이=138,150,2
7. 발전전력량=140,152,2
8. 에너지원별 발전전력량=142,154,2
9. 발전실적=144,156,2
10. 발전연료소비량=146,158,4
11. 화력발전소 열효율=150,162,2
12. 송배전 손실=152,164,2
13. 산업분류별 전력소비량=154,166,4
14. 종별수용가수 및 판매전력량=158,170,2
15. 행정구역별 수용가수=160,172,2
16. 행정구역별 판매전력량=162,174,2
17. 종별판매단가 및 판매수입=164,176,3
V. 주요에너지이용설비=167,179,3
1. 업종별 보일러현황=170,182,1
2. 용량별 보일러현황=170,182,2
3. 수송시설 및 설비=172,184,2
4. 선박척수 및 톤수=174,186,2
5. 자동차 현황=176,188,2
6. 시도별 LPG자동차현황=178,190,1
7. 태양열 이용시설 보급현황=179,191,1
8. 주요 가전기기 생산실적=180,192,3
VI. 해외에너지통계=183,195,3
1차에너지=186,198,1
1. 1차에너지원별 소비추이=186,198,2
2. 1차에너지 지역별 소비추이=188,200,2
3. 1차에너지원별 지역별 소비량(82/81)=190,202,2
석유류=192,204,1
4. 지역별 석유 및 천연가스확인매장량=192,204,2
5. 지역별 석유 생산추이=194,206,8
6. 지역별 석유 소비추이=202,214,4
7. 국별 주요제품 소비실적=206,218,4
8. 주요산유국의 원유 공시가격 변동추이=210,222,2
9. OPEC의 원유생산량=212,224,2
10. 주요국별 석유재고량 추이=214,226,1
11. 주요국별 석유제품 소매가=215,227,1
12. 지역별 천연가스 생산추이=216,228,2
13. 지역별 천연가스 소비추이=218,230,2
석탄류=220,232,1
14. 지역별 석탄매장량=220,232,2
15. 지역별 석탄생산추이=222,234,2
16. 지역별 석탄소비추이=224,236,2
17. 국별 석탄교역량=226,238,2
전력=228,240,1
18. 주요국별 전력수급추이=228,240,2
19. 주요국별 발전설비 용량=230,242,4
20. 주요국별 발전 전력량추이=234,246,4
21. 주요국별 전력소비추이=238,250,4
22. 각국의 전력판매 단가추세=242,254,2
23. 국별 원자력 발전설비현황=244,256,2
24. 지역별 원자력 소비추이=246,258,2
25. 지역별 수력 소비추이=248,260,3
VII. 주요광물자원=251,263,3
1. 광산물 생산량=254,266,4
2. 광산물 공급량=258,270,4
3. 광산물 수출량=262,274,4
4. 광산물 수입량=266,278,2
5. 자원매장량 및 광산현황=268,280,3
VIII. 주요경제통계=271,283,3
1. 주요 경제지표=274,286,4
2. 산업별 국민총생산=278,290,2
3. 도매물가 류별지수=280,292,2
4. 주요에너지 제품별 가격지수=282,294,6
5. 도매물가 특수분류별 지수=288,300,2
6. 전도시 소비자 물가지수=290,302,2
7. 대미 달러 환률=292,304,5
부록 : 참고자료=297,309,3
1. 단위 환산표=300,312,4
2. 연료 및 열의 석유환산기준=304,316,4
3. 에너지 일반개념 정의=308,320,1
4. 에너지 소비부문 분류기준=309,321,1
5. 현행 전기요금표=310,322,4
6. 전기요금 개정추이=314,326,4
판권지=318,330,1
영문목차
errata=0,1,1
[title page etc.]=0,2,5
Explanatory Notes=0,7,1
CONTENTS=0,8,1
LIST OF TABLES=I,9,5
Statistics in Charts=2,14,7
I. Total Energy=9,21,3
1. Indicators of Major Energy=12,24,2
2. Consumption of Primary Energy by Source=14,26,2
3. Consumption of Primary Energy by Source(Oil Equivalent)=16,28,2
4. Energy Consumption by Source of Supply=18,30,2
5. Energy Export and Import=20,32,2
6. Consumption of Final Energy=22,34,2
7. Consumption of Final Energy(Oil Equivalent)=24,36,2
8. Energy Consumption by Sector=26,38,8
9. Energy Consumption by Sector (Oil Equivalent)=34,46,9
II. Oil=43,55,3
1. Petroleum Supply & Demand(Total)=46,58,2
2. Petroleum Products Product ion=48,60,2
3. Domestic Consumption of Petroleum Products=50,62,2
4. Petroleum Products Export=52,64,2
5. Petroleum Products Import=54,66,2
6. Petroleum Consumption by Use and Product=56,68,12
7. Petroleum Products Consumption by Industry Sector=68,80,6
8. Crude Oil Imports by Producing Country=74,86,2
9. Crude Oil Price=76,88,2
10. Crude Oil Refinery=78,90,1
11. City Gas Supply & Demand=79,91,1
12. Petroleum Products Price=80,92,3
III. Coal=83,95,3
1. Anthracite Supply & Demand=86,98,2
2. Anthracite Production by Mine=88,100,4
3. Consumption of Anthracite by Industry=92,104,2
4. Consumption of Anthracite by Season=94,106,2
5. Anthracite Consumption in Residential and Commercial Sector by City and Province=96,108,2
6. Stock Piles of Anthracite at Year End=98,110,1
7. Imports of Anthracite=99,111,1
8. Transportation of Anthracite by Mode=100,112,2
9. Number of Anthracite Mlne=102,114,1
10. Anthracite Reserves Coalfield=103,115,1
11. Expended Budget of Coal Mining Promotion Fund=104,116,4
12. Loans for Promoting Coal Development=108,120,2
13. Coal Mining Accidents=110,122,2
14. Number of Accidents per One Million Metric Ton of Coal Produced=112,124,2
15. Price Trends of Anthracite and Briquette=114,126,2
16. Demand and Supply of Bituminous Coal=116,128,1
17. Number of Briquette Plants=117,129,2
IV. Electric Power=119,131,3
1. Overall Picture of Elecetric Power Sector=122,134,4
2. Generating Facilities=126,138,2
3. Trend of Generating Facilities by Plant=128,140,6
4. Transmission Facilities=134,146,2
5. Substation Facilities=136,148,2
6. Distribution Facilities=138,150,2
7. Power Generation=140,152,2
8. Power Generation by Energy Source=142,154,2
9. Power Generating Results=144,156,2
10. Fuel Consumption for Generation=146,158,4
11. Thermal Plant Efficiency=150,162,2
12. Transmission and Distribution Losses=152,164,2
13. Consumption of Electric Power by Industry=154,166,4
14. Revenues by Tariff and Number of Customers=158,170,2
15. Number of Customers by Province=160,172,2
16. Power Sold by Province=162,174,2
17. Average Revenues per Kwh and Revenues from Sales by Tariff=164,176,3
V. Major Energy Facilities=167,179,3
1. Number of Boilers by Sector=170,182,1
2. Installation of Boilers by Capacity=170,182,2
3. Transport Facilities and Equipments=172,184,2
4. Number of Vessels and Tonnage=174,186,2
5. Number of Motor Vehicles=176,188,2
6. LPG Motor Vehicles by Province=178,190,1
7. Solar Energy Using Facilities=179,191,1
8. Production of Major Electric Appliances=180,192,3
VI. World Energy Statistics=183,195,3
PRIMARY ENERGY=186,198,1
1. Primary Energy Consumption=186,198,2
2. World Primary Energy Consumption=188,200,2
3. World Primary Energy Consumption(82/81)=190,202,2
OIL=192,204,1
4. World Reserves of Oil and Gas by Region=192,204,2
5. World Oil Production by Region=194,206,8
6. World Oil Consumption by Region=202,214,4
7. Main Product Consumption by Country=206,218,4
8. Government Crude Oil Sales Prices=210,222,2
9. OPEC Crude Oil Production=212,224,2
10. Oil Stock by Major Country=214,226,1
11. Retail Price of Petroleum Product by Major Country=215,227,1
12. World Natural Gas Production by Region=216,228,2
13. World Natural Gas Consumption by Region=218,230,2
COAL=220,232,1
14. World Coal Reserves and Production by Region=220,232,2
15. World Coal Production by Region=222,234,2
16. World Coal Consumption by Region=224,236,2
17. World Coal Trade by Country=226,238,2
ELECTRIC POWER=228,240,1
18. Trend of World Power Demand & Supply by Major Country=228,240,2
19. World Generating Facilities by Major Country=230,242,4
20. The Trend of World Power Generation by Major Country=234,246,4
21. World Power Consumption by Major Country=238,250,4
22. Unit Price of Power Sold by Country=242,254,2
23. Nuclear Generation Facilities by Country=244,256,2
24. Nuclear Energy Consumption=246,258,2
25. World Water Power Consumption=248,260,3
VII. Major Mineral Resources=251,263,3
1. Major Mineral Production=254,266,4
2. Mineral Products Supply=258,270,4
3. Mineral Products Export=262,274,4
4. Mineral Products Import=266,278,2
5. Reserves of Resource and Number of Mine=268,280,3
VIII. Major Economic Statistics=271,283,3
1. Major Statistics of Economy=274,286,4
2. Industrial Origin of GNP=278,290,2
3. Wholesale Price Indices by Commodity=280,292,2
4. Major Energy Products Price Indices=282,294,6
5. Wholesale Price Indices by Special Groups=288,300,2
6. All Cities Consumer Price Indices=290,302,2
7. Exchange Rate to U. S. Dollar=292,304,5
Appendix and Reference Data=297,309,3
1. Conversion Factors=300,312,4
2. Conversion Standard to Oil Equivalent by Fuel=304,316,4
3. General Conception of Energy=308,320,1
4. Classification Criteria for Energy Consumption Sector=309,321,1
5. Table for Current Power Rate=310,322,4
6. Trend of Revision in Power Rate=314,326,4
copyright=318,330,1
통계도표=2,14,1
1. 국민총생산 에너지소비추이=4,16,1
2. 국내에너지와 수입에너지 비중=4,16,1
3. 에너지원별소비=5,17,1
4. 수요부문별 에너지 소비=6,18,2
5. 석유류 제품별 수요=8,20,1
6. 발전설비ㆍ생산ㆍ판매전력추이=8,20,1
| 등록번호 | 청구기호 | 권별정보 | 자료실 | 이용여부 |
|---|---|---|---|---|
| 0000363389 | R 338.0186 ㅎ155ㅇ | 1983 | 서울관 서고(열람신청 후 1층 대출대) | 이용가능 |
| 0000363390 | R 338.0186 ㅎ155ㅇ | 1983 | 부산관 서고(열람신청 후 2층 주제자료실) | 이용가능 |
*표시는 필수 입력사항입니다.
| 전화번호 |
|---|
| 기사명 | 저자명 | 페이지 | 원문 | 기사목차 |
|---|
| 번호 | 발행일자 | 권호명 | 제본정보 | 자료실 | 원문 | 신청 페이지 |
|---|
도서위치안내: / 서가번호:

우편복사 목록담기를 완료하였습니다.
*표시는 필수 입력사항입니다.
저장 되었습니다.
