
 대표어
대표어


권호기사보기
| 기사명 | 저자명 | 페이지 | 원문 | 기사목차 |
|---|
결과 내 검색
동의어 포함
목차
표제지=0,1,2
국민교육헌장=0,3,1
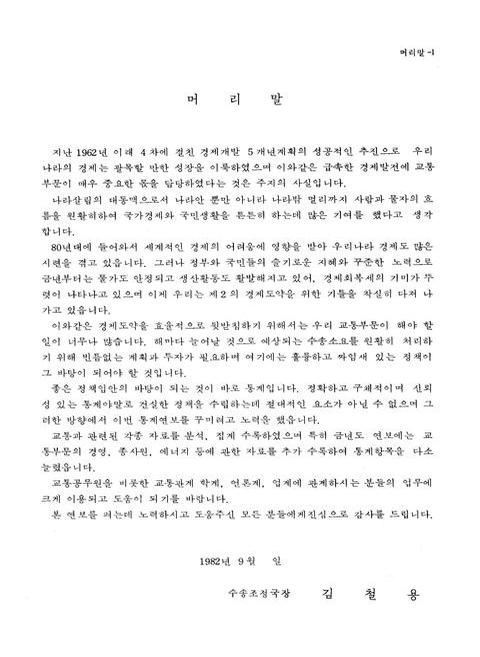
머리말=1,4,12
일러두기=13,16,1
차례=14,17,10
1. 총괄=1,27,3
(1-1) 종합수송지수=4,30,1
(1-2) 산업별 국민총생산=5,31,1
(1-3) 국내 총자본 형성=5,31,1
(1-4) 교통부문 부가가치 및 구성비=6,32,1
(1-5) G.N.P와 교통부문 성장율=6,32,1
(1-6) 기본수량추이=7,33,1
(1-7) 국내여객 수송=8,34,2
(1-8) 국내화물 수송=10,36,2
(1-9) 국제여객 및 화물수송=12,38,2
(1-10) 부문별 수송=14,40,14
(1-11) 주요품목별 수송=28,54,16
(1-12) 경과년한별 수송장비=42,70,1
(1-13) 외화수입=45,71,3
(1-14) 수송수단별 사고=48,74,9
2. 철도=57,83,2
(2-1) 철도건상황=59,85,1
(2-2) 전국철도현황=60,86,2
(2-3) 여객수송=62,88,4
(2-4) 화물수송=66,92,2
(2-5) 품목별수송=78,94,8
(2-6) 선별여객수송=76,102,4
(2-7) 선별화물수송=80,106,8
(2-8) 동력차별운전거리=88,114,2
(2-9) 경과년한별 차량현황=90,116,1
(2-10) 차량키로=91,117,1
(2-11) 여객사고 및 배상금 지출=92,118,2
(2-12) 화물사고 및 배상금 지출=94,120,2
(2-13) 차량현황=96,122,2
(2-14) 주요품목별 거리대별 수송=98,124,3
3. 지하철=101,127,2
(3-1) 시설 및 장비=103,129,1
(3-2) 지하철 수송=104,130,6
(3-3) 지하철 사고=110,136,1
(3-4) 배상금 지출=110,136,1
4. 공로=111,137,3
(4-1) 영업용 자동차 수송=114,140,4
(4-2) 영업용 자동차 시·도별 수송=118,144,12
(4-3) 고속버스 수송=130,156,28
(4-4) 비영업용 자동차 수송=158,184,4
(4-5) 영업용 자동차 시·도별 등록=162,188,2
(4-6) 자동차 현황=164,190,4
(4-7) 자동차 면허대수=168,194,2
(4-8) 도로현황=170,196,2
(4-9) 자동차 생산=172,198,2
(4-10) 자동차 정비공장=174,200,1
(4-11) 창고업 현황=175,201,1
(4-12) 자동차 정류장 현황=176,202,1
(4-13) 도로보수비 연도별 집행현황=177,203,2
5. 해운·항만=179,205,2
(5-1) 정기여객선 수송=181,207,2
(5-2) 낙도보조 항로수송=183,209,3
(5-3) 콘테이너 수송=186,212,2
(5-4) 화물 수송=188,214,4
(5-5) 품목별 화물수송=192,218,4
(5-6) 품목별 외항화물 수송=196,222,16
(5-7) 품목별 연안화물 수송=212,238,4
(5-8) 항별 화물수송=216,242,24
(5-9) 선박 및 화물입출항=240,266,4
(5-10) 지역별 외항선박 및 화물입출항=244,270,12
(5-11) 항별 선박현황=256,282,8
(5-12) 지방별 등록선박=264,290,2
(5-13) 톤수별 등록선박=266,292,2
(5-14) 선령별 등록선박=268,294,1
(5-15) 항로표지 시설=269,295,2
(5-16) 주요항만 시설현황=271,297,2
6. 항공=273,299,2
(6-1) 민간항공 수송=275,301,13
(6-2) 민간항공 노선별 수송=288,314,23
(6-3) 항공기 보유량=311,337,1
(6-4) 항공기 등록현황=312,338,5
7. 관광=317,343,2
(7-1) 외래관광객 및 외화수입=319,345,1
(7-2) 목적별 외래관광객 현황=320,346,2
(7-3) 국적별 외래관광객 현황=322,348,12
(7-4) 월별 외래관광객 현황=334,360,2
(7-5) 관광사업체 시·도별 등록현황=336,362,1
(7-6) 시·도별 관광호텔=337,363,1
(7-7) 관광선전책자 발간=338,364,1
(7-8) 관광호텔 객실이용율=339,365,1
(7-9) 관광지 및 공원=340,366,1
8. 해난심판 및 수로=341,367,2
(8-1) 해난심판=343,369,1
(8-2) 종류별 해난사고=344,370,4
(8-3) 선종별 해난사고=348,374,2
(8-4) 원인별 해난사고=350,376,2
(8-5) 해기원별 해난사고=352,378,4
(8-6) 선박 톤수별 해난사고=356,382,2
(8-7) 징계별 해난심판=358,384,2
(8-8) 수로측량=360,386,9
(8-9)해양관측=469,395,1
(8-10) 수로도지 간행=370,396,1
부록=371,397,2
1. 주요 수송지표=373,399,1
(1-1) 국내여객 수송=374,400,4
(1-2) 국내화물 수송=378,404,2
(1-3) 국제여객 및 화물수송=380,406,2
2. 운수사업의 자본금 계급별 회사수=382,408,1
3. 수송관계 업종별 수입 및 급여현황=382,408,1
4. 자동차 배출가스 규제기준=383,409,1
5. 교통통계 용어해설=384,410,9
판권지=0,419,1
O 국내수송수단별 구조(1981)=0,6,1
O 국제수송수단별 구조(19810=0,7,1
O 국내여객수송=0,8,2
O 국내화물수송=0,10,2
O 국제여객수송=0,12,1
O 국제화물수송=0,13,1
O 주요품목별 수송(1981)=0,14,1
O 외화수입=0,15,1
O 목적별 외래관광객 현황=0,15,1
영문목차
TITLE PAGE=0,1,15
NOTES=0,16,2
CONTENTS=0,18,9
1. General=1,27,3
(1-1) Composite Traffic Index=4,30,1
(1-2) Gross National Product by Industry=5,31,1
(1-3) Gross Domestic Capital Formation=5,31,1
(1-4) Transport Sector Added Values and Composition Ratio=6,32,1
(1-5) Growth Rate of G.N.P. and Transport Added Value=6,32,1
(1-6) Volume Trends=7,33,1
(1-7) Domestic Passenger Traffic=8,34,2
(1-8) Domestic Freight Traffic=10,36,2
(1-9) International Passenger and Freight Traffic=12,38,2
(1-10) Traffic by Mode of Transport=14,40,14
(1-11) Traffic by Major Commodities=28,54,16
(1-12) Transport Equipments by Age Group=44,70,1
(1-13) Annual Foreign Exchange Receipts=45,71,3
(1-14) Accidents by Mode of Transport=48,74,9
2. Railway=57,83,2
(2-1) Railway Construction=59,85,1
(2-2) Major Railway Lines=60,86,2
(2-3) Passenger Transport=62,88,4
(2-4) Freight Transport=66,92,2
(2-5) Transport by Commodities=68,94,8
(2-6) Passenger Transport by Railway Lines=76,102,4
(2-7) Freight Transport by Railway Lines=80,106,8
(2-8) Milage by Type of Locomotive=88,114,2
(2-9) Rolling Stocks by Age Group=90,116,1
(2-10) Milage of Rolling Stocks Operation=91,117,1
(2-11) Passenger Accidents and Compensation Payments=92,118,2
(2-12) Freight Accidents and Compensation Payments=94,120,2
(2-13) Rolling Stocks=96,122,2
(2-14) Traffic by Commodities & Distance=98,124,3
3. Subway=101,127,2
(3-1) Facilities and Equipment=103,129,1
(3-2) Subway Traffic Performance=104,130,6
(3-3) Subway Accidents=110,136,1
(3-4) Compensation Payments=110,136,1
4. Highway=111,137,3
(4-1) Traffic Performance of Commercial Motor Vehicle=114,140,4
(4-2) Traffic Performance of Commercial Motor Vehicle by Province=118,144,12
(4-3) Traffic Performance by Express Highway Bus=130,156,28
(4-4) Transport by Non-Commercial Motor Vehicles=158,184,4
(4-5) Registered Commercial Motor Vehicle by Province=162,188,2
(4-6) Number of Motor Vehicles=164,190,4
(4-7) Number of Motor Vehicle Licensed=168,194,2
(4-8) Length of Roads=170,196,2
(4-9) Motor Vehicle Production=172,198,2
(4-10) Factory of Vehicle Repair=174,200,1
(4-11) Status of Warehouse Operation=175,201,1
(4-12) Motor Vehicle Terminals=176,202,1
(4-13) Annual Expenditure for Road Repair=177,203,2
5. Maritime and Port=179,205,2
(5-1) Passenger Traffic by Regular Vessels=181,207,2
(5-2) Passenger Traffic by Subsidized Vessels=183,209,3
(5-3) Container Traffic=186,212,2
(5-4) Cargo Traffic=188,214,4
(5-5) Cargo Traffic by Commodities=192,218,4
(5-6) Overseas Cargo Transport by Commodities=196,222,16
(5-7) Coastal Cargo Transport by Commodities=212,238,4
(5-8) Cargo Transport by Ports=216,242,24
(5-9) Vessels and Cargoes In and Out Port=240,266,4
(5-10) Overseas Vessel and Cargoes In and Out Port by Region=244,270,12
(5-11) Statistics Vessels by Ports=256,282,8
(5-12) Registered Vessel by Districts=264,290,2
(5-13) Registered Vessels by Tonnage=266,292,2
(5-14) Registered Vessels by Age Group=268,294,1
(5-15) Navigation Aids=269,295,2
(5-16) Infrastructure of Major Ports=271,297,2
6. Civil Aviation=273,299,2
(6-1) Performance of Civil Air Transport=275,301,13
(6-2) Performance of Civil Air Transport by Route=288,314,23
(6-3) Aircraft Holdings=311,337,1
(6-4) Aircraft Registrations=312,338,5
7. Tourism=317,343,2
(7-1) Number of Foreign Visitors and Foreign Exchange Earned=319,345,1
(7-2) Number of Foreign Visitors by Purpose=320,346,2
(7-3) Number of Foreign Visitors by Nationality=322,348,12
(7-4) Number of Foreign Visitors by Month=334,360,2
(7-5) Tourist Industries Registration by Province=336,362,1
(7-6) Registered Hotels by Province=337,363,1
(7-7) Publication of Tourist Literatures=338,364,1
(7-8) Occupancy Rate of Registered Hotels=339,365,1
(7-9) Tourist Area and Parks=340,366,1
8. Marine Accidents Inquiries and Hydrographics=341,367,2
(8-1) Marine Accidents Inquiries=343,369,1
(8-2) Marine Accidents by Type=344,370,4
(8-3) Marine Accidents by Type of Vessel=348,374,2
(8-4) Marine Accidents by Cause=350,376,2
(8-5) Marine Accidents by Crew Competency=352,378,4
(8-6) Marine Accidents by Vessels Tonnage=356,382,2
(8-7) Marine Accidents by Type of Penalty=358,384,2
(8-8) Hydrographic Survey=360,386,9
(8-9) Oceanographic Observation=369,395,1
(8-10) Publication of Nautical Charts and Documents=370,396,1
Appendix=371,397,2
1. Major Statistical Index of Transport=373,399,1
(1-1) Domestic Passenger Transport=374,400,4
(1-2) Domestic Freight Transport=378,404,2
(1-3) International Passenger and Freight Transport=380,406,2
2. No. of Establishments by Size of Capital Stock=382,408,1
3. Status of Income and Remuneration by Sub-Industry=382,408,1
4. Standard to Regulate the Exhaust Gas of Motor Vehicle=383,409,1
5. Definition of Terminology used in This Report=384,410,10
jpg
도표-3 국내수송수단별 구조(1981)=0,6,1
도표-4 국제수송수단별 구조(1981)=0,7,1
도표-5 국내여객수송=0,8,1
도표-6 국내여객수송=0,9,1
도표-7 국내화물수송=0,10,1
도표-8 국내화물수송=0,11,1
도표-9 국제여객수송=0,12,1
도표-10 국제화물수송=0,13,1
도표-11 주요품목별수송(1981)=0,14,1
도표-12 외화수입=0,15,1
| 등록번호 | 청구기호 | 권별정보 | 자료실 | 이용여부 |
|---|---|---|---|---|
| 0000339090 | R 385.058 ㄱ384 | 1982 | 서울관 서고(열람신청 후 1층 대출대) | 이용가능 |
| 0000339091 | R 385.058 ㄱ384 | 1982 | 부산관 서고(열람신청 후 2층 주제자료실) | 이용가능 |
*표시는 필수 입력사항입니다.
| 전화번호 |
|---|
| 기사명 | 저자명 | 페이지 | 원문 | 기사목차 |
|---|
| 번호 | 발행일자 | 권호명 | 제본정보 | 자료실 | 원문 | 신청 페이지 |
|---|
도서위치안내: / 서가번호:

우편복사 목록담기를 완료하였습니다.
*표시는 필수 입력사항입니다.
저장 되었습니다.
