표목차[표1-1]지역별 각 가구당 영양소의 성인환산율의 평균 및 표준편차=24,25,1
The mean and standard deviation of conversion ratio for recommended dietary allowance of adult per household by area=24,25,1
[표1-2]국민영양조사 보고서의 가구당 영양권장량에 대한 섭취비율의 계산방법=25,26,1
The method of calculating intake ratio to nutrient allowance per household=25,26,1
[표2-1]영양소별 섭취량=35,36,1
The nutrient intake per capita per day and adjusted nutrient intake per adult=35,36,1
[표2-2]영양소별 섭취량의 연차적 추이(전국 1인 1일)=36,37,1
The annual changes of nutrient intake(Nationwide, per capita per day)=36,37,1
[표2-3]조사대상의 평균영양권장량에 대한 영양소 섭취비율의 연차적 추이=37,38,1
The annual changes of the proportions of nutrient intake to the average nutrient allowance=37,38,1
[표2-4]영양소별 영양권장량에 대한 영양소 섭취비율(전국)=38,39,1
The number and proportions of nutrient intake to the average nutrient allowance(Nationwide)=38,39,1
[표2-5]식품군별 에너지섭취비율의 연차적 추이(전국 1인 1일)=39,40,1
The annual changes of the proportions of the average energy intake by food groups(Nationwide, per capita per day)=39,40,1
[표2-6]식품군별 단백질섭취비율의 연차적 추이(전국 1인 1일)=40,41,1
The annual changes of the proportions of the average protein intake by food groups(Nationwide, per capita per day)=40,41,1
[표2-7]식품군별 지방섭취비율의 연차적 추이(전국 1인 1일)=41,42,1
The annual changes of the proportions of the average fat intake by food groups(Nationwide, per capita per day)=41,42,1
[표2-8]식품군별 평균 영양소 섭취량(전국 1인 1일)=42,43,2
The proportions of the average nutrient intake by food groups(Nationwide, per capita per day)=42,43,2
[표2-9]식품군별 평균 영양소 섭취비율(전국 1인 1일)=44,45,2
The proportions of the average nutrient intake by food groups(Nationwide, per capita per day)=44,45,2
[표2-10]식품군별 섭취량의 연차적 추이(전국 1인 1일)=52,53,1
The annual changes of food intake by food groups(Nationwide, per capita per day)=52,53,1
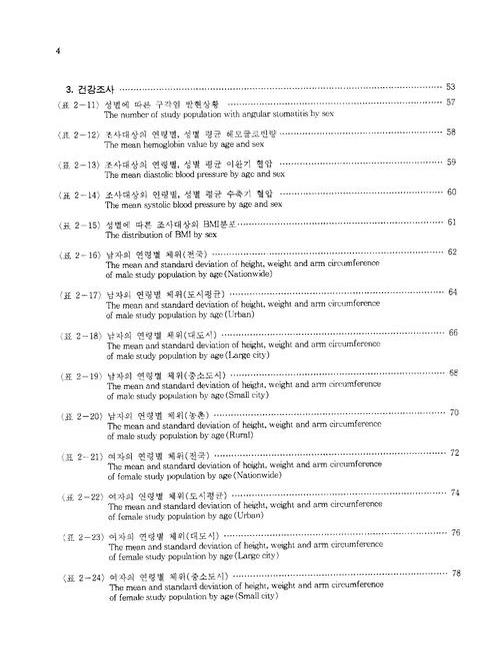
[표2-11]성별에 따른 구각염 발현상황=57,58,1
The number of study population with angular stomatitis by sex=57,58,1
[표2-12]조사대상의 연령별, 성별 평균 헤모글빈량=58,59,1
The mean hemoglobin value by age and sex=58,59,1
[표2-13]조사대상의 연령별, 성별 평균 이완기 혈압=59,60,1
The mean diastolic blood pressure by age and sex=59,60,1
[표2-14]조사대상의 연령별, 성별 평균 수축기 혈압=60,61,1
The mean systolic blood pressure by age and sex=60,61,1
[표2-15]성별에 따른 조사대상의 BMI분포=61,62,1
The distribution of BMI by sex=61,62,1
[표2-16]남자의 연령별 체위(전국)=62,63,2
The mean and standard deviation of height, weight and arm circumference of male study population by age(Nationwide)=62,63,2
[표2-17]남자의 연령별 체위(도시평균)=64,65,2
The mean and standard deviation of height, weight and arm circumference of male study population by age(Urban)=64,65,2
[표2-18]남자의 연령별 체위(대도시)=66,67,2
The mean and standard deviation of height, weight and arm circumference of male study population by age(Large city)=66,67,2
[표2-19]남자의 연령별 체위(중소도시)=68,69,2
The mean and standard deviation of height, weight and arm circumference of male study population by age(Small city)=68,69,2
[표2-20]남자의 연령별 체위(농촌)=70,71,2
The mean and standard deviation of height, weight and arm circumference of male study population by age(Rural)=70,71,2
[표2-21]여자의 연령별 체위(전국)=72,73,2
The mean and standard deviation of height, weight and arm circumference of female study population by age(Nationwide)=72,73,2
[표2-22]여자의 연령별 체위(도시평균)=74,75,2
The mean and standard deviation of height, weight and arm circumference of female study population by age(Urban)=74,75,2
[표2-23]여자의 연령별 체위(대도시)=76,77,2
The mean and standard deviation of height, weight and arm circumference of female study population by age(Large city)=76,77,2
[표2-24]여자의 연령별 체위(중소도시)=78,79,2
The mean and standard deviation of height, weight and arm circumference of female study population by age(Small city)=78,79,2
[표2-25]여자의 연령별 체위(농촌)=80,81,2
The mean and standard deviation of height, weight and arm circumference of female study population by age(Rural)=80,81,2
[표3-1]지역별 영양소별 섭취량(전국 1인 일)=95,96,1
The nutrient intake by area per capita per day=95,96,1
[표3-2]지역별 영양소별 섭취량(성인 1인 일)=96,97,1
The nutrient intake by area per capita per day for adult=96,97,1
[표3-3]영양소별 섭취량의 연차적 추이(전국 1인 1일)=97,98,2
The annual changes of nutrient intake(Nationwide, per capita per day)=97,98,2
[표3-4]지역별 조사대상의 평균영양권장량에 대한 영양소 섭취비율=99,100,1
The proportions of nutrient intake to the average nutrient allowance by area=99,100,1
[표3-5]조사대상의 평균영양권장량에 대한 영양소 섭취비율의 연차적 추이=103,104,1
The annual changes of the proportions of nutrient intake to the average nutrient allowance=103,104,1
[표3-6]각 영양소별로 영양권장량의 75%미만을 섭취하는 가구의 수와 비율=104,105,1
The number and proportions of households with less than 75% of the average nutrient allowance=104,105,1
[표3-7]각 영양소별로 영양권장량의 125%이상을 섭취하는 가구의 수와 비율=105,106,1
The number and proportions of households with more than 125% of the average nutrient allowance=105,106,1
[표3-8]에너지 1,000㎉당 평균 영양소 섭취량(지역별 전국 1인 1일)=106,107,1
The nutrient intake per 1,000㎉(Area, per capita per day)=106,107,1
[표3-9]식품군별 평균 영양소 섭취량(도시평균 1인 1일)=108,109,2
The average nutrient intake by food groups(Urban, per capita per day)=108,109,2
[표3-10]식품군별 평균 영양소 섭취량(대도시 1인 1일)=110,111,2
The average nutrient intake by food groups(Large city, per capita per day)=110,111,2
[표3-11]식품군별 평균 영양소 섭취량(중소도시 1인 1일)=112,113,2
The average nutrient intake by food groups(Small city, per capita per day)=112,113,2
[표3-12]식품군별 평균 영양소 섭취량(농촌 1인 1일)=114,115,2
The average nutrient intake by food groups(Rural, per capita per day)=114,115,2
[표3-13]식품군별 평균 영양소 섭취비율(도시평균 1인 1일)=116,117,2
The proportions of the average nutrient intake by food groups(Urban, per capita per day)=116,117,2
[표3-14]식품군별 평균 영양소 섭취비율(대도시 1인 1일)=118,119,2
The proportions of the average nutrient intake by food groups(Large city, per capita per day)=118,119,2
[표3-15]식품군별 평균 영양소 섭취비율(중소도시 1인 1일)=120,121,2
The proportions of the average nutrient intake by food groups(Small city, per capita per day)=120,121,2
[표3-16]식품군별 평균 영양소 섭취비율(농촌 1인 1일)=122,123,2
The proportions of the average nutrient intake by food groups(Rural, per capita per day)=122,123,2
[표3-17]조사대상자의 에너지 권장량에 대한 에너지 섭취비율의 빈도=124,125,1
The number of households by the proportions of energy intake to the allowance=124,125,1
[표3-18]조사대상자의 단백질 권장량에 대한 단백질 섭취비율의 빈도=125,126,1
The number of households by the proportions of protein intake to the allowance=125,126,1
[표3-19]조사대상자의 칼슘 권장량에 대한 칼슘 섭취비율의 빈도=126,127,1
The number of households by the proportions of calcium intake to the allowance=126,127,1
[표3-20]조사대상자의 철분 권장량에 대한 철분 섭취비율의 빈도=127,128,1
The number of households by the proportions of iron intake to the allowance=127,128,1
[표3-21]조사대상자의 비타민A 권장량에 대한 비타민A 섭취비율의 빈도=128,129,1
The number of households by the proportions of vitamin A intake to the allowance=128,129,1
[표3-22]조사대상자의 티아민 권장량에 대한 티아민 섭취비율의 빈도=129,130,1
The number of households by the proportions of thiamin intake to the allowance=129,130,1
[표3-23]조사대상자의 리보플라빈 권장량에 대한 리보플라빈 섭취비율의 빈도=130,131,1
The number of households by the proportions of riboflavin intake to the allowance=130,131,1
[표3-24]조사대상자의 나이아신 권장량에 대한 나이아신 섭취비율의 빈도=131,132,1
The number of households by the proportions of niacin intake to the allowance=131,132,1
[표3-25]조사대상자의 비타민C 권장량에 대한 비타민C 섭취비율의 빈도=132,133,1
The number of households by the proportions of vitamin C intake to the allowance=132,133,1
[표3-26]조사대상자의 에너지섭취량에 대한 지방에너지 섭취비율의 분포=142,143,1
The distribution of energy intake from fat versus total energy intake=142,143,1
[표3-27]조사대상자의 지방섭취량에 대한 동물성지방 섭취비율의 분포=143,144,1
The distribution of animal fat versus total fat intake=143,144,1
[표3-28]식품군별 1인 1일당 섭취량(지역별)=144,145,1
The food intake by food groups and area per capita per day(Area)=144,145,1
[표3-29]식품군별 섭취량의 연차적 추이(전국 1인 1일)=148,149,3
The annual changes of food intake by food groups(Nationwide, per capita per day)=148,149,3
[표3-30]식품별 1인 1일당 섭취량(지역별)=152,153,12
The food intake by food items per capita per day(Area)=152,153,12
[표3-31]식품군별 1인 1일당 섭취량(시ㆍ도별)=164,165,4
The food intake by food groups and province per capita per day=164,165,4
[표3-32]식품별 1인 1일당 섭취량(시ㆍ도별)=168,169,32
The food intake by food item and province per capita per day=168,169,32
[표3-33]조사대상의 성별 신장에 대한 체중분포(전국)=203,204,1
The mean weight for height of study population(Nationwide)=203,204,1
[표3-34]조사대상의 성별 신장에 대한 체중분포(도시평균)=204,205,1
The mean weight for height of study population(Urban)=204,205,1
[표3-35]조사대상의 성별 신장에 대한 체중분포(대도시)=205,206,1
The mean weight for height of study population(Large city)=205,206,1
[표3-36]조사대상의 성별 신장에 대한 체중분포(중소도시)=206,207,1
The mean weight for height of study population(Small city)=206,207,1
[표3-37]조사대상의 성별 신장에 대한 체중분포(농촌)=207,208,1
The mean weight for height of study population(Rural)=207,208,1
[표3-38]조사대상의 신장, 체중에 대한 상완위분포(전국)=208,209,2
The mean arm circumference for height and weight of study population(Nationwide)=208,209,2
[표3-39]조사대상의 신장, 체중에 대한 상완위분포(도시계)=210,211,2
The mean arm circumference for height and weight of study population(Urban)=210,211,2
[표3-40]조사대상의 신장, 체중에 대한 상완위분포(대도시)=212,213,2
The mean arm circumference for height and weight of study population(Largy city)=212,213,2
[표3-41]조사대상의 신장, 체중에 대한 상완위분포(중소도시)=214,215,2
The mean arm circumference for height and weight of study population(Small city)=214,215,2
[표3-42]조사대상의 신장, 체중에 대한 상완위분포(농촌)=216,217,2
The mean arm circumference for height and weight of study population(Rural)=216,217,2
[표3-43]지역별 조사대상의 BMI분포(남자)=218,219,1
The distribution of BMI by area(Male)=218,219,1
[표3-44]지역별 조사대상의 BMI분포(여자)=219,220,1
The distribution of BMI by area(Female)=219,220,1
[표3-45]구각염 발현상황(전국)=220,221,2
The number of study population with angular stomatitis(Nationwide)=220,221,2
[표3-46]구각염 발현상황(남자)=222,223,2
The number of study population with angular stomatitis(Male)=222,223,2
[표3-47]구각염 발현상황(여자)=224,225,2
The number of study population with angular stomatitis(Female)=224,225,2
[표3-48]구각염이 있는 가구당 가구원수에 따른 영양소섭취량(전국 1인 1일)=226,227,1
The nutrient intake per household by the number of family member with angular stomatitis(Nationwide, per capita per day)=226,227,1
[표3-49]구각염이 있는 가구당 가구원수에 따른 영양권장량에 대한 섭취량의 비율(전국 1인 1일)=227,228,1
The poportions of nutrient intake to the average nutrient allowance by angular stomatitis(Nationwide, per capita per day)=227,228,1
[표3-50-1]지역별 조사대상의 헤모글로빈 분포(남자)=228,229,1
The distribution of the number of study population by the hemoglobin value(Male)=228,229,1
[표3-50-2]지역별 조사대상의 헤모글로빈 분포(여자)=229,230,1
The distribution of the number of study population by the hemoglobin value(Female)=229,230,1
[표3-50-3]지역별 조사대상의 헤모글로빈 분포(0~6세)=230,231,1
The distribution of the number of study population by the hemoglobin value=230,231,1
[표3-50-4]지역별 조사대상의 헤모글로빈 분포( ~14세)=230,231,1
The distribution of the number of study population by the hemoglobin value=230,231,1
[표3-51-1]지역별 조사대상의 이완기 혈압 분포(남자)=231,232,1
The distribution of the study population by diastolic blood pressure(Male)=231,232,1
[표3-51-2]지역별 조사대상의 이완기 혈압 분포(여자)=232,233,1
The distribution of the study population by diastolic blood pressure(Female)=232,233,1
[표3-52-1]지역별 조사대상의 수축기 혈압 분포(남자)=233,234,1
The distribution of the study population by systolic blood pressure(Male)=233,234,1
[표3-52-2]지역별 조사대상의 수축기 혈압 분포(여자)=234,235,1
The distribution of the study population by systolic blood pressure(Female)=234,235,1
[표3-53]지역별 조사대상의 연령별 성별 분포=238,239,4
The number and distribution of study population by area, age and sex=238,239,4
[표3-54]지역별 가구원수=242,243,1
The number of family member by area=242,243,1
[표3-55]가구원수별 가구당 영양소 섭취량(전국 1인 1일)=244,245,2
The nutrient intake per household by by the number of family member(Nationwide, per capita per day)=244,245,2
[표3-56]가구원수별 가구당 영양권장량에 대한 섭취량의 비율(전국 1인 1일)=246,247,1
The proportions of nutrient intake to the average nutrient allowance by the number of family member(Nationwide, per capita per day)=246,247,1
[표3-57]주택소유형태(지역별)=247,248,1
The number of households by the kind of housing(Area)=247,248,1
[표3-58]주택소유형태에 따른 가구당 영양소섭취량(전국 1인 1일)=248,24,2
The nutrient intake per households by the kind of housing=248,24,2
[표3-59]주택소유형태에 따른 가구당 영양권장량에 대한 섭취량의 비율(전국 1인 1일)=250,251,1
The proportions of nutrient intake to the average nutrient allowance by the kind of housing(Nationwide, per capita per day)=250,251,1
[표3-60]방의 수(지역별)=251,252,1
The number of households by the number of rooms and the area=251,252,1
[표3-61]1인당 방의 수에 따른 가구당 영양소 섭취량(전국 1인 1일)=252,253,2
The nutrient intake per household by the number of rooms per capita(Nationwide, per capita per day)=252,253,2
[표3-62]1인당 방의 수에 따른 가구당 영양권장량에 대한 섭취량의 비율(전국 1인 1일)=254,255,1
The proportions of nutrient intake to the average nutrient allowance by the number of rooms per capita(Nationwide, per capita per day)=254,255,1
[표3-63]난방연료 이용상황(지역별)=254,255,1
The number of households by the kind of fuel(area)=254,255,1
[표3-64]난방연료 이용상황에 따른 가구당 영양소섭취량(전국 1인 1일)=256,257,2
The nutrient intake per household by the house fuel used(Nationwide, per capita per day)=256,257,2
[표3-65]난방연료 이용상황에 따른 가구당 영양권장량에 대한 섭취량의 비율(전국 1인 1일)=258,259,1
The proportions of nutrient intake to the average nutrient allowance by the house fuel used(Nationwide, per capita per day)=258,259,1
[표3-66]화장실 이용상황(지역별)=259,260,1
The number of households by the kind of toilet(Area)=259,260,1
[표3-67]화장실 이용상황에 따른 가구당 영양소섭취량(전국 1인 1일)=260,261,2
The nutrient intake per household by the kind of toilet(Nationwide, per capita per day)=260,261,2
[표3-68]화장실 이용상황에 따른 가구당 영양권장량에 대한 섭취량의 비율(전국 1인 1일)=262,263,1
The proportions of nutrient intake to the average nutrient allowance by the kind of toilet(Nationwide, per capita per day)=262,263,1
[표3-69]식품보관시설(지역별)=263,264,1
Food storage equipment(Area)=263,264,1
[표3-70]식품보관시설별 가구당 영양소섭취량(전국 1인 1일)=264,265,2
The nutrient intake per household by food storage equipment(Nationwide, per capita per day)=264,265,2
[표3-71]식품보관시설별 가구당 영양권장량에 대한 섭취량의 비율(전국 1인 1일)=266,267,1
The proportions of nutrient intake to the average nutrient allowance by food storage equipment(Nationwide, per capita per day)=266,267,1
[표3-72]취사연료(주식) 이용상황(지역별)=267,268,1
The number of households by the kind of cooking fuel for main dish(Area)=267,268,1
[표3-73]취사연료(주식) 이용상황에 따른 가구당 영양소 섭취량(전국 1인 1일)=268,269,2
The nutrient intake per household by the kind of cooking fuel for main dish(Nationwide, per capita per day)=268,269,2
[표3-74]취사연료(주식) 이용상황에 따른 가구당 영양권장량에 대한 섭취량의 비율(전국 1인 1일)=270,271,1
The proportions of nutrient intake to the average nutrient allowance by the kind of cooking fuel for main dish(Nationwide, per capita per day)=270,271,1
[표3-75]취사연료(부식) 이용상황(지역별)=271,272,1
The number of households by the kind of cooking fuel for side dish(Area)=271,272,1
[표3-76]취사연료(부식) 이용상황에 따른 가구당 영양소 섭취량(전국 1인 1일)=272,273,2
The nutrient intake per household by the kind of cooking fuel for side dish(Nationwide, per capita per day)=272,273,2
[표3-77]취사연료(부식) 이용상황에 따른 가구당 영양권장량에 대한 섭취량의 비율(전국 1인 1일)=274,275,1
The proportions of nutrient intake to the average nutrient allowance by the kind of cooking fuel for side dish(Nationwide, per capita per day)=274,275,1
[표3-78]급수시설 이용상황(지역별)=275,276,1
The number of households by the kind of water supply(Area)=275,276,1
[표3-79]급수시설 이용상황에 따른 가구당 영양소 섭취량(전국 1인 1일)=276,277,2
The nutrient intake per household by the kind of water supply(Nationwide, per capita per day)=276,277,2
[표3-80]급수시설 이용상황에 따른 가구당 영양권장량에 대한 섭취량의 비율(전국 1인 1일)=278,279,1
The proportions of nutrient intake to the averagenutrient allowance by the kind of water supply(Nationwide)=278,279,1
[표3-81]가구원의 교육정도(지역별)=279,280,1
The number of study population by the level of education(Area)=279,280,1
[표3-82]가구주의 교육정도에 따른 가구당 영양소 섭취량(전국 1인 1일)=280,281,2
The nutrient intake per household by the level of education of householder(Nationwide, per capita per day)=280,281,2
[표3-83]가구주의 교육정도에 따른 가구당 영양권장량에 대한 섭취량의 비율(전국 1인 1일)=282,283,1
The proportions of nutrient intake to the average nutrient allowance by the level of education of householders(Nationwide, per capita per day)=282,283,1
[표3-84]식품 조리자 분류(지역별)=283,284,1
The number of households by the kind of the meal preparer(Area)=283,284,1
[표3-85]식품 조리자의 교육정도(지역별)=284,285,1
The number of households by the educational level of the mel preparer(Area)=284,285,1
[표3-86]식품 조리자의 교육정도별 영양소 섭취량(전국 1인 1일)=285,286,2
The nutrient intake by the educational level of the meal preparer(Nationwide, per capita per day)=285,286,2
[표3-87]식품 조리자의 교육정도별 영양권장량에 대한 섭취량의 비율(전국 1인 1일)=288,289,1
The proportions of nutrient intake to the average nutrient allowance by the educational level of the meal preparer(Nationwide, per capita per day)=288,289,1
[표3-88]가구원의 활동정도(지역별)=289,290,1
The number of study population by the level of activity(Area)=289,290,1
[표3-89]가구주의 활동정도(지역별)=290,291,1
The number of household by the level of activity(Area)=290,291,1
[표3-90]가구주의 활동정도에 따른 가구당 영양소 섭취량(전국 1인 1일)=291,292,2
The nutrient intake per household by the level of activity of householder(Nationwide, per capita per day)=291,292,2
[표3-91]가구주의 활동정도에 따른 가구당 영양권장량에 대한 섭취량의 비율(전국 1인 1일)=294,295,1
The proportions of nutrient intake to the average nutrient allowance by the level of activity of householders(Nationwide, per capita per day)=294,295,1
[표3-92]월평균 총 수입 상황=295,296,1
The number of households by the level of income and mean income per month(Area)=295,296,1
[표3-93]가구원수에 따른 지역별 월평균 수입=296,297,1
The mean income of surveyed households by the area and the number of family member=296,297,1
[표3-94]가구원수별 총수입 상황(전국)=297,298,1
The number ofhouseholds by the level of income and the number of family member(Nationwide)=297,298,1
[표3-95]총수입에 따른 가구당 영양소 섭취량(전국 1인 1일)=298,299,2
The nutrient intake per household by the level of income(Nationwide, per capita per day)=298,299,2
[표3-96]총수입에 따른 가구당 영양권장량에 대한 섭취량의 비율(전국 1인 1일)=300,301,1
The proportions of nutrient intake to the averagenutrient allowance per household by the level of income(Nationwide, per capita per day)=300,301,1
[표3-97]월평균 가구 총수입별 식비지출율=301,302,1
The rate of food expenses per household and the monthly expenses for staples and sidedishes by the level of income=301,302,1
[표3-98]식비지출율에 의한 가구당 영양소 섭취량(전국 1인 1일)=302,303,2
The nutrient intake per household by the rate of food expense(Nationwide, per capita per day)=302,303,2
[표3-99]식비지출율에 의한 가구당 영양권장량에 대한 섭취량의 비율(전국 1인 1일)=304,305,1
The proportions of nutrient intake to the average nutrient allowance per household by the rate of food expense(Nationwide, per capita per day)=304,305,1
[표3-100]1일 평균 식비 상황(지역별)=305,306,1
The mean food expense per day(Area)=305,306,1
[표3-101]가구원수별 1일 평균 식비상황(전국)=305,306,1
The mean food expenses per day by the number of family member(Nationwide)=305,306,1
[표3-102]가구원수에 따른 식품군별 평균구입가격(전국)=306,307,2
The mean food expense of the number of family member by food groups(Nationwide)=306,307,2
[표3-103]가구원수에 따른 식품군별 평균구입가격(도시평균)=308,309,2
The mean food expense of the number of family member by food groups(Urban)=308,309,2
[표3-104]가구원수에 따른 식품군별 평균구입가격(대도시)=310,311,2
The mean food expense of the number of family member by food groups(Large city)=310,311,2
[표3-105]가구원수에 따른 식품군별 평균구입가격(중소도시)=312,313,2
The mean food expense of the number of family member by food groups(Small city)=312,313,2
[표3-106]가구원수에 따른 식품군별 평균구입가격(농촌)=314,315,2
The mean food expense of the number of family member by food groups(Rural)=314,315,2
[표3-107-1]지역별 1일 가구당 식품군별 평균구입가격=316,317,2
The mean food expense by food groups and area=316,317,2
[표3-107-2]가구원수에 따른 식품별 평균구입가격(전국)=318,319,7
The mean food expense of the number of family member by food items(Nationwide)=318,319,7
[표3-108]영양 취약상태 분포(지역별)=325,326,1
The distribution of the number of study population at the nutritional risk(Area)=325,326,1
[표3-109]생후 6개월까지 영아가 있는 가구=325,326,1
The distribution with younger than 6 months infant by area=325,326,1
[표3-110]생후 6개월 이내의 영유아가 있는 가구수 및 수유형태(지역별)=326,327,1
The number of households with younger than 6 month old infants by the kind of feeding practice(Area)=326,327,1
[표3-111]모유 수유시 젖뗀 시기(지역별)=327,328,1
The number of younger than 2 year-old-baby by the weaning period of breastfeeding(Area)=327,328,1
[표3-112]보충식의 시작시기(지역별)=327,328,1
The number of younger than 2 year-old-baby by the starting age of supplemented feeding(Area)=327,328,1
[표3-113]보충식의 시작종류(지역별)=328,329,1
The number of younger than 2 year-old-baby by the kind of first supplemented food used(Area)=328,329,1
[표3-114]보충식의 형태(지역별)=329,330,1
The number of younger than 2 year-old-baby by the preparation of supplemented food(Area)=329,330,1
[표3-115]생후 6개월 이내의 영아가 있는 가구와 없는 가구의 영양소 섭취량(전국 1인 1일)=330,331,1
The nutrient intake per household with and without younger than 6 month old infant(Nationwide, per capita per day)=330,331,1
[표3-116]생후 6개월 이내의 영아가 있는 가구수와 없는 가구수의 영양권장량에 대한 섭취량의 비율(전국 1인 1일)=330,331,1
The proportions of nutrient intake to the average of nutrient allowance with and without younger than 6 month old infant(Nationwide, per capita per day)=330,331,1
[표3-117]연령별 식사상황(전국)=331,332,2
The number of meal by age(Nationwide)=331,332,2
[표3-118]연령별 식사상황(남자)=334,335,2
The number of meal by age(Male)=334,335,2
[표3-119]연령별 식사상황(여자)=336,337,2
The number of meal by age(Female)=336,337,2
[표3-120]연령별 식사상황(도시평균)=338,339,2
The number of meal by age(Urban)=338,339,2
[표3-121]연령별 식사상황(대도시)=340,341,2
The number of meal by age(Large city)=340,341,2
[표3-122]연령별 식사상황(중소도시)=342,343,2
The number of meal by age(Small city)=342,343,2
[표3-123]연령별 식사상황(농촌)=344,345,2
The number of meal by age(Rural)=344,345,2
[표3-124]직업별 식사상황(전국)=346,347,2
The number of meal by the kind of occupation(Nationwide)=346,347,2
[표3-125]직업별 식사상황(도시평균)=348,349,2
The number of meal by the kind of occupation(Urban)=348,349,2
[표3-126]직업별 식사상황(대도시)=350,351,2
The number of meal by the kind of occupation(Large city)=350,351,2
[표3-127]직업별 식사상황(중소도시)=352,353,2
The number of meal by the kind of occupation(Small city)=352,353,2
[표3-128]직업별 식사상황(농촌)=354,355,2
The number of meal by the kind of occupation(Rural)=354,355,2
[표3-129]끼니별 식사상황(전국)=356,357,1
The number of meal by the kind of regular meal(Nationwide)=356,357,1
[표3-130]끼니별 식사상황(남자)=356,357,1
The number of meal by the kind of regular meal(Male)=356,357,1
[표3-131]끼니별 식사상황(여자)=357,358,1
The number of meal by the kind of regular meal(Female)=357,358,1
[표3-132]끼니별 식사상황(도시평균)=357,358,1
The number of meal by the kind of regular meal(Urban)=357,358,1
[표3-133]끼니별 식사상황(대도시)=358,359,1
The number of meal by the kind of regular meal(Large city)=358,359,1
[표3-134]끼니별 식사상황(중소도시)=358,359,1
The number of meal by the kind of regular meal(Small city)=358,359,1
[표3-135]끼니별 식사상황(농촌)=359,360,1
The number of meal by the kind of regular meal(Rural)=359,360,1
[표3-136]지역별 조사대상 지구 및 가구분포(1992년도)=363,364,5
The distribution of household and area surveyed(1992)=363,364,5
[표3-137]국민영양조사에서 분류한 식품군별 식품명=368,369,30
The food items by food groups in National Nutrition Survey=368,369,30
The distribution of energy intake from fat versus total energy intake=47,48,1
The annual changes of energy intake and percentage of energy from cereal(Nationwide)=93,94,1
The annual changes of protein intake and the percentage of protein from animal sources(Nationwide)=94,95,1
The comparison of the nutrient intake and the average nutrient allowance(1992)=100,101,1
The comparison of the nutrient intake and the average nutrient allowance by year(Nationwide)=101,102,1
The number of household by the proportions of energy intake to the allowance=133,134,1
The number of household by the proportions of protein intake to the allowance=134,135,1
The number of household by the proportions of calcium intake to the allowance=135,136,1
The number of household by the proportions of iron intake to the allowance=136,137,1
The number of household by the proportions of vitamin A intake to the allowance=137,138,1
The number of household by the proportions of thiamin intake to the allowance=138,139,1
The number of household by the proportions of riboflavin intake to the allowance=139,140,1
The number of household by the proportions of niacin intake to the allowance=140,141,1
The number of household by the proportions of vitamin C intake to the allowance=141,142,1
The annual changes of nutrient intake by food groups(Nationwide, per capita per day)=151,152,1