[표제지 등]
제출문
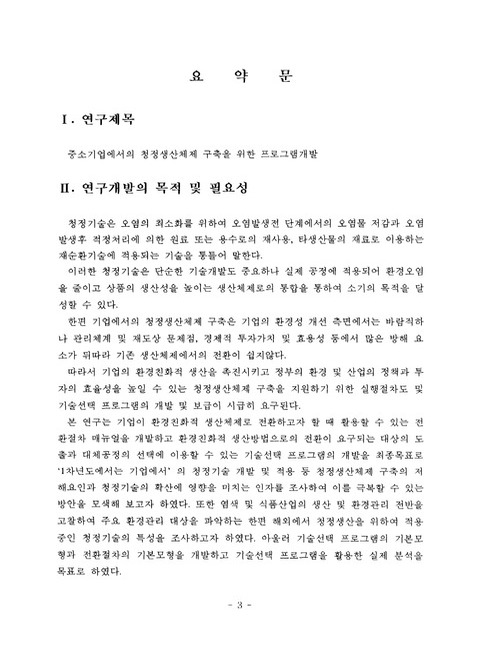
요약문
Summary
List of Table
List of Figure
목차
제1장 서론 17
제2장 중소기업에서의 청정기술 개발·적용 저해 및 확산인자에 관한 조사 24
제1절 중소기업의 일반현황 24
제2절 저해요인 및 확산인자에 관한 설문조사 28
제3장 식품산업과 환경 153
제1절 식품산업의 일반적 특징 153
제2절 식품산업의 현황 및 주요 환경관리대상 162
제3절 적용 가능한 사전예방기술 177
제4장 염색산업과 환경 213
제1절 염색산업의 특징 213
제2절 염색산업현황 및 주요 환경관리대상 215
제3절 적용가능한 사전예방 기술 226
제5장 청정생산체제 구축을 위한 프로그램개발 266
제1절 기술선택 프로그램의 일반모형 266
제2절 청정생산체제의 구축을 위한 전환절차 매뉴얼의 일반모형 318
제6장 결론 및 요약 332
참고문헌 339
부록 I. 청정기술 개발 및 적용 저해인자 및 확산요인 조사를 위한 설문 341
부록 II. 청정생산 관련 금융 및 조세지원 358
부록 III. 인터넷을 활용한 청정기술 정보수집 371
[title page etc.]
Summary
Contents
Chapter 1. Introduction 17
Chapter 2. Survey of factors affecting the R&D and the diffusion of clean technologies in SMEs 24
Section 1. General aspects of SMEs in Korea 24
Section 2. Barriers on the development(develpoment) and adoption of cleantechnologies in SEMs 28
Chapter 3. Food processing industry and environment 153
Section 1. Characteristics of food processing industry 153
Section 2. Current status and major targets for environmental management 162
Section 3. Pollution prevention technologies adopted in food industry 177
Chapter 4. Dyeing industry and environment 213
Section 1. Characteristics of dyeing industry 213
Section 2. Current status and major targets for environmental management 215
Section 3. Pollution prevention technologies adopted in dyeing industry 226
Chaper 5. Development of programme for establishment of cleaner production system 266
Section 1. Basic programme for Selection of technology and process 266
Section 2. Basic model of manual for management system transfer 318
Chapter 6. Conclusion and summary 332
Reference 339
Appendix 341
List of Table(Table 1.1) Methods for cleaner production 20
(Table 2.1) Proportion of SMEs in economic activities(1993년말 현재) 25
(Table 2.2) Cooperation association in Dyeing industry 26
(Table 2.3) Cooperation association in food processing industry 27
(Table 3.1) Food mass balance(1994) 154
(Table 3.2) Self-sufficient ration of food(1994) 155
(Table 3.3) Processing rate of agro-marine products(1990) 155
(Table 3.4) Grain consumption per capita(1994) 156
(Table 3.5) Processed production of fruits and vegetables(1994) 156
(Table 3.6) Trend of increasing rate by industry(1990년 불변물가 기준) 157
(Table 3.7) Growth rate of agroculture, forestry and fisheries 157
(Table 3.8) Growth rate of industry 158
(Table 3.9) Trend of consumption growth rate 158
(Table 3.10) Output and shipment of processed food(1994) 160
(Table 3.11) Equipment investment by industry(Foodstuff) 161
(Table 3.12) Classification of food industry 162
(Table 3.13) Current status of food industry 163
(Table 3.14) Number of establishment by food industry 163
(Table 3.15) Processed food production(1994) 164
(Table 3.16) Waste generation on food industry 165
(Table 3.17) Trend of hazardous(hazadous) Waste generation 166
(Table 3.18) Variety and generation of hazardous(hazadous) waste('94) 166
(Table 3.19) Hazardous(Hazadous) waste generation by industry 167
(Table 3.20) Water consumption, wastewater generation per day 168
(Table 3.21) Wastewater resource and quality by food processing 169
(Table 3.22) Waste treatment system 177
(Table 4.1) Characteristics of dyes 214
(Table 4.2) Dyes correspond to textiles 214
(Table 4.3) General characteristics by dyeing processes 215
(Table 4.4) Weight of dyeing in textile industry 216
(Table 4.5) Number of establishment by dyeing industry 216
(Table 4.6) Dyeing works location by section 216
(Table 4.7) Current status of Dyeing production 217
(Table 4.8) Dyeing production by items 218
(Table 4.9) Dyeing production by section 219
(Table 4.10) Production, export(expet), import of dyes 220
(Table 4.11) Demand of main primarily and subsidiary materials 220
(Table 4.12) Comparison of water cost 221
(Table 4.13) Comparison of Water consumption, wastewater generation and wastewater treatment cost 221
(Table 4.14) Redyeing rate in dyeing 222
(Table 4.15) Quality of wastewater by dyeing industry 225
(Table 5.1) Consideration factors on process simulation 269
(Table 5.2) Consideration factors on concentration analysis in each process units 269
(Table 5.3) Consideration factors on process optimization 270
(Table 5.4) Consideration factors on modeling 270
(Table 5.5) Consideration factors on simulation without proper model 271
(Table 5.6) Consideration factors for environmental cost analysis 271
(Table 5.7) Consideration factors on environmental impact evaluation 272
(Table 5.8) Consideration factors on process evaluation 272
(Table 5.9) Method for calculation of fixed investments 279
(Table 5.10) Specification of main equipment and example of cost calculation 280
(Table 5.11) Calculation method for annual operation cost 281
(Table 5.12) Stream report 298
(Table 5.13) Overall material balance (kg/h averaged) 299
(Table 5.14) Stream report 299
(Table 5.15) Lumped environmental stream properties section 302
(Table 5.16) Overall balance section (Environmental load(per Hour)) 303
(Table 5.17) Lumped environmental stream properties section 304
(Table 5.18) Solid waste section 305
(Table 5.19) Liquid waste section 306
(Table 5.20) Emissions section 307
(Table 5.21) Pollution indices section 308
(Table 5.22) Major equipment specification and fob cost(1996 prices) 311
(Table 5.23) Fixed capital estimate summary(1996 prices) 312
(Table 5.24) Waste treatment/disposal in method 2(1996 prices) 313
(Table 5.25) Waste treatment/dispose in method 1(1996 prices) 313
(Table 5.26) Annual operating cost (1996 prices) 314
(Table 5.27) Profitability analysis (1996 prices) 315
(Table 5.28) Annual operating cost in method 1 (1996 prices) 316
(Table 5.29) Properbility analysis in method 2 (1996 prices) 317
(Table 5.31) Type of information and its use 322
(Table 5.32) Checklists for field inspection 324
(Table 5.33) Guideline for field inspection 325
(Table 5.34) Effects of selected method 329
List of Figure
(Fig.1.1) Fundamental factors on cleaner production 18
(Fig.1.2) Strategies for cleaner production 19
(Fig.1.3) Cost comparison in cleaner production with pollution control 21
(Fig.3.1) Relation between food and other industries 153
(Fig.3.2) Diagram of food mass balance(1994) 154
(Fig.3.3) Flow diagram of rice processing 170
(Fig.3.4) Flow diagram of milling 171
(Fig.3.5) Flow diagram of bakery process 171
(Fig.3.6) Flow diagram of noodles production 172
(Fig.3.7) Flow diagram(daigram) of milk product processing 173
(Fig.3.8) Flow diagram of starch production 174
(Fig.3.9) Flow diagram of edible oil and fat production 174
(Fig.3.10) Flow diagram of bean curd production 175
(Fig.3.11) Flow diagram of canned fruit production 175
(Fig.3.12) Flow diagram of beer production 175
(Fig.3.13) Flow diagram of production 176
(Fig 4.1) Flow diagram for dyeing process 223
(Fig 4.2) Process of wastewater treatment in dyeing industry 225
(Fig.5.1) Basic concept of process/technology selection programme 268
(Fig.5.2) Current flow sheet of process and pollution index 277
(Fig.5.3) Pollution index after process improvement 278
(Fig.5.4) Main production process flowsheet, Method 1 296
(Fig.5.5) Main production process flowsheet, Method 2 297
(Fig.5.6) Basic concept of manual for cleaner production system establishment 319
(Fig.5.7) Flowsheet of cleaner production system 331