


권호기사보기
| 기사명 | 저자명 | 페이지 | 원문 | 기사목차 |
|---|
| 대표형(전거형, Authority) | 생물정보 | 이형(異形, Variant) | 소속 | 직위 | 직업 | 활동분야 | 주기 | 서지 | |
|---|---|---|---|---|---|---|---|---|---|
| 연구/단체명을 입력해주세요. | |||||||||
|
|
|
|
|
|
* 주제를 선택하시면 검색 상세로 이동합니다.
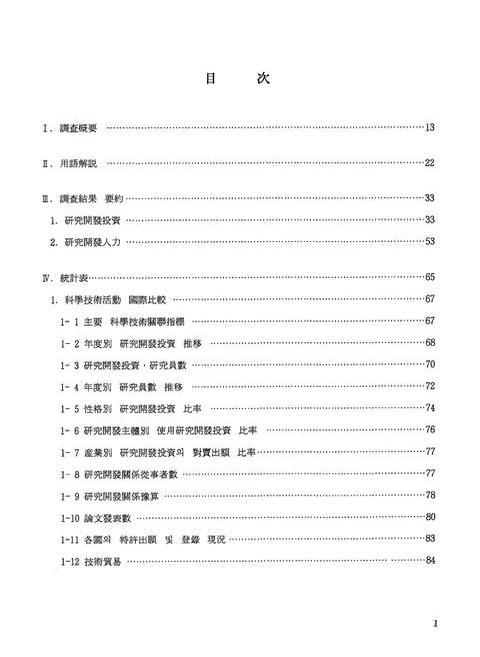
목차
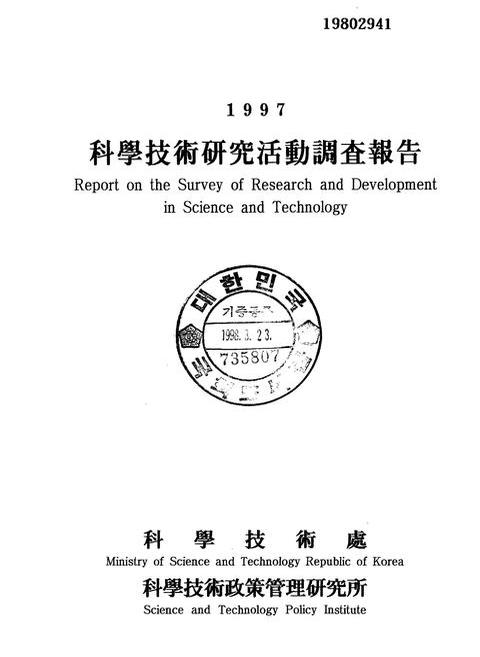
표제지=0,1,1
머리말=0,2,1
목차=1,3,12
I. 조사개요=13,15,1
1. 조사목적=13,15,1
2. 조사근거=13,15,1
3. 조사연혁=13,15,1
4. 조사대상=14,16,2
5. 조사기준 시점 및 기간=15,17,1
6. 조사사항=15,17,2
7. 조사방법=16,18,1
8. 조사결과 공표=16,18,6
II. 용어해설=22,24,1
1. 연구개발활동=22,24,1
2. 연구개발활동 예시=22,24,2
3. 재원별 연구개발투자=23,25,1
4. 성격별 연구개발투자=23,25,2
5. 비목별 연구개발투자=24,26,2
6. 연구개발관계종사자=25,27,8
III. 조사결과요약=33,35,1
1. 연구개발투자=33,35,21
2. 연구개발인력=53,55,12
IV. 통계표=65,67,2
1. 과학기술활동 국제비교=67,69,1
1-1 주요 과학기술관련지표=67,69,1
1-2 연도별 연구개발투자 추이=68,70,2
1-3 연구개발 투자ㆍ연구원수=70,72,2
1-4 연도별 연구원수 추이=72,74,2
1-5 성격별 연구개발투자 비율=74,76,2
1-6 연구개발주체별 사용연구개발투자 비율=76,78,1
1-7 산업별 사용연구개발투자의 대매출액 비율=77,79,1
1-8 연구개발관계 종사자수=77,79,1
1-9 연구개발관계예산=78,80,2
1-10 논문발표수=80,82,3
1-11 각국의 특허출원 및 등록현황(WIPO)=83,85,1
1-12 기술무역=84,86,2
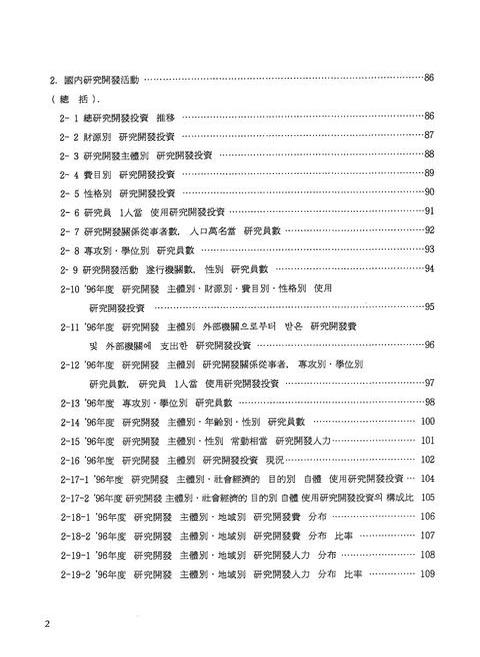
2. 국내 연구개발활동=86,88,1
2-1 총연구개발투자 추이=86,88,1
2-2 재원별 연구개발투자=87,89,1
2-3 연구개발주체별 연구개발투자=88,90,1
2-4 비목별 연구개발투자=89,91,1
2-5 성격별 연구개발투자=90,92,1
2-6 연구원 1인당 사용연구개발투자=91,93,1
2-7 연구관계종사자수, 인구만명당 연구원수=92,94,1
2-8 전공별ㆍ학위별 연구원수=93,95,1
2-9 연구활동 수행기관수, 성별 연구원수=94,96,1
2-10 '96년도 연구개발주체별ㆍ재원별ㆍ비목별ㆍ성격별 사용연구개발투자=95,97,1
2-11 '96년도 연구개발주체별 외부기관으로부터 받은 연구개발비 및 외부기관에 지출한 연구개발투자=96,98,1
2-12 '96년도 연구개발주체별 연구개발관계종사자, 전공별ㆍ학위별 연구원수, 연구원 1인당 사용연구개발투자=97,99,1
2-13 '96년도 전공별ㆍ학위별 연구원수=98,100,2
2-14 '96년도 연구개발주체별ㆍ연령별 성별 연구원수=100,102,1
2-15 '96년도 연구개발주체별ㆍ성별 상근상당 연구개발 인력=101,103,1
2-16 '96년도 연구개발주체별 연구개발투자현황=102,104,2
2-17-1 '96년도 연구개발주체별ㆍ사회경제적 목적별 자체사용 연구개발투자=104,106,1
2-17-2 96년도 연구개발주체별 사회경제적 목적별 자체사용 연구개발투자의 구성비=105,107,1
2-18-1 '96년도 연구개발주체별, 지역별 연구개발비 분포=106,108,1
2-18-2 '96년도 연구개발주체별, 지역별 연구개발비 분포비율=107,109,1
2-19-1 '96년도 연구개발주체별, 지역별 연구개발인력 분포=108,110,1
2-19-2 '96년도 연구개발주체별, 지역별 연구개발인력 분포비율=109,111,1
2-20-1 '96년도 연구개발주체별, 지역별 연구개발조직 분포=110,112,1
2-20-2 '96년도 연구개발주체별, 지역별 연구개발조직 분포비율=111,113,1
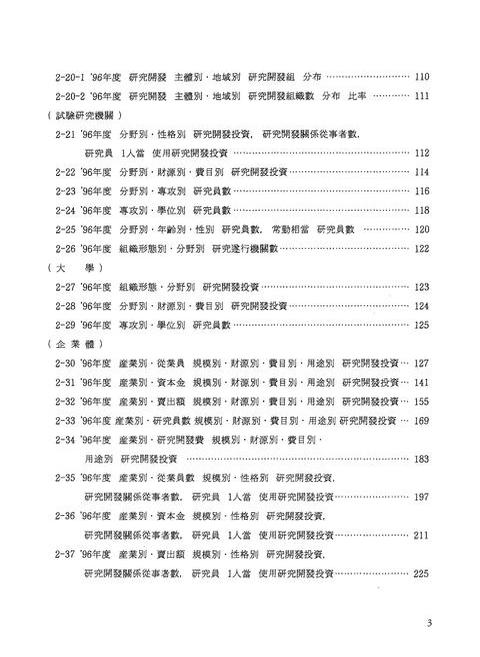
2-21 '96년도 분야별ㆍ성격별 연구개발투자, 연구개발관계종사자수, 연구원1인당 사용 연구개발투자(시험연구기관)=112,114,2
2-22 '96년도 분야별ㆍ재원별ㆍ비목별 연구개발투자(시험연구기관)=114,116,2
2-23 '96년도 분야별ㆍ전공별 연구원수(시험연구기관)=116,118,2
2-24 '96년도 전공별ㆍ학위별 연구원수(시험연구기관)=118,120,2
2-25 '96년도 분야별ㆍ연령별ㆍ성별 연구원수, 상근상당연구원수(시험연구기관)=120,122,2
2-26 '96년도 조직형태별ㆍ분야별 연구수행기관수(시험연구기관)=122,124,1
2-27 '96년도 조직형태별ㆍ분야별 연구개발투자(대학)=123,125,1
2-28 '96년도 조직형태별ㆍ재원별ㆍ비목별 연구개발투자(대학)=124,126,1
2-29 '96년도 전공별ㆍ학위별 연구원수(대학)=125,127,2
2-30 '96년도 산업별ㆍ종업원 규모별ㆍ재원별ㆍ비목별ㆍ용도별 연구개발투자(기업체)=127,129,14
2-31 '96년도 산업별ㆍ자본금 규모별ㆍ재원별ㆍ비목별ㆍ용도별 연구개발투자(기업체)=141,143,14
2-32 '96년도 산업별ㆍ매출액 규모별ㆍ재원별ㆍ비목별ㆍ용도별 연구개발투자(기업체)=155,157,14
2-33 '96년도 산업별ㆍ연구원수 규모별ㆍ재원별ㆍ비목별ㆍ용도별 연구개발투자(기업체)=169,171,14
2-34 '96년도 산업별ㆍ연구개발비규모별ㆍ재원별ㆍ비목별ㆍ용도별 연구개발투자(기업체)=183,185,14
2-35 '96년도 산업별ㆍ종업원수 규모별ㆍ성격별 연구개발투자, 연구개발관계종사자수, 연구원1인당 사용연구개발투자(기업체)=197,199,14
2-36 '96년도 산업별ㆍ자본금ㆍ규모별ㆍ성격별 연구개발투자, 연구개발관계종사자수, 연구원1인당 사용연구개발투자(기업체)=211,213,14
2-37 '96년도 산업별ㆍ매출액 규모별ㆍ성격별 연구개발투자, 연구개발관계종사자수, 연구원1인당 사용연구개발투자(기업체)=225,227,14
2-38 '96년도 산업별ㆍ연구원수 규모별ㆍ성격별 연구개발투자, 연구개발관계종사자수, 연구원1인당 사용연구개발투자(기업체)=239,241,14
2-39 '96년도 산업별ㆍ연구개발비 규모별ㆍ성격별 연구개발투자, 연구개발관계종사자수, 연구원1인당 사용연구개발투자(기업체)=253,255,14
2-40 '96년도 산업별ㆍ종업원 규모별 매출액 대비 자체사용 연구개발투자, 자체부담연구개발투자(기업체)=267,269,10
2-41 '96년도 산업별ㆍ자본금 규모별 매출액 대비 자체사용 연구개발투자, 자체부담연구개발투자(기업체)=277,279,10
2-42 '96년도 산업별ㆍ기업 규모별 매출액 대비 자체사용 연구개발투자, 자체부담연구개발투자(기업체)=287,289,8
2-43 '96년도 산업별ㆍ종업원 규모별 연구원 1인당 연구개발투자, 종업원 천명당 연구원수(기업체)=295,297,10
2-44 '96년도 산업별ㆍ자본금 규모별 연구원 1인당 연구개발투자, 종업원 천명당 연구원수(기업체)=305,307,10
2-45 '96년도 산업별ㆍ연령별ㆍ성별 연구원수, 상근상당 연구원수(기업체)=315,317,5
2-46 '96년도 산업별ㆍ전공별 연구원수(기업체)=320,322,4
2-47 '96년도 전공별ㆍ학위별 연구원수(기업체)=324,326,2
2-48 '96년도 산업별ㆍ학위별 연구원수(기업체)=326,328,4
2-49 '96년도 산업별 연구개발투자 집중도(기업체)=330,332,2
2-50 '96년도 산업별 연구원수 집중도(기업체)=332,334,2
2-51 '96년도 산업별 매출액 집중도(기업체)=334,336,2
3. 산업재산권=336,338,1
3-1 권리별 산업재산권의 출원 및 등록건수=336,338,1
3-2 부문별 특허출원 및 등록건수=337,339,1
3-3. 국적별 특허출원 및 등록건수=338,340,1
4. 기술무역=339,341,1
4-1 기술무역액 추이=339,341,1
4-2 기술수출현황=340,342,1
4-3 국별 기술도입건수 및 대가지급 현황=341,343,1
4-4 업종별 기술도입건수 및 대가지급 현황=342,344,2
4-5 국별ㆍ업종별 기술도입신고 현황(1996. 12. 31 현재)=344,346,1
5. 주요국의 연구개발활동통계=345,347,1
5-1 조직별 연구개발투자 추이(미국)=345,347,1
5-2 재원별 연구개발투자 추이(미국)=346,348,1
5-3 성격별 연구개발투자 추이(미국)=346,348,1
5-4 연구원수 및 노동인구 만명당 연구원수 추이(미국)=347,349,1
5-5 제조업 및 비제조업 연구개발투자 추이(미국)=347,349,1
5-6 산업별 부담연구개발투자 매출액대비율 추이(미국)=348,350,1
5-7 조직별 연구개발투자 추이(일본)=349,351,1
5-8 재원별 연구개발투자 추이(일본)=349,351,1
5-9 성격별 연구개발투자 추이(일본)=350,352,1
5-10 연구개발관계종사자수 추이(일본)=350,352,1
5-11 산업별 사용연구개발투자의 대 매출액 비율 추이(일본)=351,353,1
5-12 조직별 연구개발투자 추이(독일)=352,354,1
5-13 재원별 연구개발투자 추이(독일)=353,355,1
5-14 성격별 연구개발투자 추이(독일)=353,355,1
5-15 조직별 연구원수 추이(독일)=354,356,1
5-16 산업별 연구개발투자 및 연구원수(독일, 1993)=354,356,1
5-17 조직별 연구개발투자 추이(프랑스)=355,357,1
5-18 연구개발투자의 재원별 부담비율 추이(프랑스)=355,357,1
5-19 조직별 연구원수 추이(프랑스)=356,358,1
5-20 산업별 연구개발투자 및 연구원수(프랑스, 1994)=356,358,1
5-21 조직별 연구개발투자 추이(영국)=357,359,1
5-22 재원별 연구개발투자 추이(영국)=357,359,1
5-23 산업별 연국개발투자(영국)=358,360,1
5-24 조직별 연구원수 추이(영국)=358,360,1
6. 일반경제통계=359,361,1
6-1 국민총생산ㆍ인구ㆍGNP 디플레이터=359,361,1
6-2 산업생산지수, 물가지수, 수출, 수입, 경상수지, 외환보유액=360,362,1
6-3 주요국의 국민총생산, 1인당 국민총생산(경상가격)=361,363,1
6-4 주요국의 환율=362,364,1
부록=363,365,2
과학기술연구개발활동조사표(기업체용)=365,367,12
과학기술연구개발활동조사표(연구기관, 연구조합 및 협회용)=377,379,11
과학기술연구개발활동조사표(의료기관 및 대학부속병원용)=388,390,11
과학기술연구개발활동조사표(대학 및 전문대학의 이공계 분야용)=399,401,8
판권지=407,409,1
영문목차
title page=0,1,8
CONTENETS=7,9,10
I. Outline of the Survey=17,19,1
1. Objective of the Survey=17,19,1
2. Legal Basis for the Survey=17,19,1
3. History of the Survey=17,19,2
4. Coverage=18,20,2
5. Periods Covered by the Survey=19,21,1
6. Survey Items=20,22,1
7. Survey Methods=20,22,1
8. Publication of the Survey Results=21,23,6
II. Explanation of Terms=27,29,1
1. Research and Development Activities=27,29,1
2. Examples of Distinguishing R&D from Non-P&D Activities=27,29,2
3. R&D Expenditures by Source of Funds=28,30,1
4. R&d Expenditures by Character of Work=28,30,2
5. Intramural R&D Expenditures=29,31,2
6. Personnel Engaged in R&D Activities=31,33,2
III. Summary of the Survey=33,35,1
1. R&D expenditures=33,35,21
2. Personnel engaged in R&D activities=53,55,12
IV. Statistical Tables=65,67,2
1. International comparison of science and technology activities=67,69,1
1-1 Major indicators concerning science and technology activities by nation=67,69,1
1-2 R&D expenditures by year=68,70,2
1-3 R&D expenditures and researchers=70,72,2
1-4 R&D researchers by year=72,74,2
1-5 R&D expenditures by character of work=74,76,2
1-6 R&D expenditures by sector of performance=76,78,1
1-7 R&D expenditures as a percent of total sales by industry=77,79,1
1-8 Personnel engaged in R&D activitios=77,79,1
1-9 Budget for Research and Development=78,80,2
1-10 Number of scientific and technical papers=80,82,3
1-11 Status of Patents applied and registered of each country=83,85,1
1-12 Technological balance of payments=84,86,2
2. R&D activities in Korea=86,88,1
2-1 R&D expenditures=86,88,1
2-2 R&D expenditures by source of funds=87,89,1
2-3 R&D expenditures by sector of performance=88,90,1
2-4 R&D expenditures by type of costs=89,91,1
2-5 R&D expenditures by character of work=90,92,1
2-6 R&D expendutures per researcher by sector of performance=91,93,1
2-7 Personnel engaged in R&D, researchers per 10,000 population by sector of performance=92,94,1
2-8 Researchers by major field of study and degree=93,95,1
2-9 R&D performing institutes, researchers by sex=94,96,1
2-10 Intramural R&D expenditures by sector of performance, source of funds, type of costs, character of work('96)=95,97,1
2-11 R&D exp. received from and paid to outside by sector of performance('96)=96,98,1
2-12 Personnel engaged in R&D activites, researchers by major filed of study and degree and R&D exp. per researcher by sector of performance('96)=97,99,1
2-13 Researchers by major field of study and degree('96)=98,100,2
2-14 Researchers by sector of performance, by age and sex('96)=100,102,1
2-15 F.T. equivalent R&D personnel by sector of performance and sex('96)=101,103,1
2-16 R&D exp. by sector of performance('96)=102,104,2
2-17-1 R&D exp. by sector of performance and socio-economic objectives('96)=104,106,1
2-17-2 R&D exp. by sector of performance and socio-economic objectivies(96)=105,107,1
2-18-1 R&D exp. by sector of performance and rgion('96)=106,108,1
2-18-2 R&D exp. by sector of performance and region('96)=107,109,1
2-19-1 R&D exp. By sector of performance and region('96)=108,110,1
2-19-2 Researchers by sector of performance and region('96)=109,111,1
2-20-1 R&D perform units by sector of performance and region('96)=110,112,1
2-20-2 R&D perform units by sector of performance and region('96)=111,113,1
2-21 R&D exp. by character of work, personnel engaged in R&D and annual R&D exp. per researcher by field(Research institutes:'96)=112,114,2
2-22 R&D exp. by field, source of funds and type of costs(Research institutes:'96)=114,116,2
2-23 Researchers by field and major field of study(Research institutes:'96)=116,118,2
2-24 Researchers by major field of study and degree Headcount(Research insititutes:'96)=118,120,2
2-25 Researchers and F.T equivalent researchers by field, age and sex(Research insititutes:'96)=120,122,2
2-26. R&D performing insititutes by kind of organization and field(Research insititutes:'96)=122,124,1
2-27. Intramural R&D expenditures by type of organization and field(Univ.College:'96)=123,125,1
2-28 R&D exp. by type of organization, source of funds and type of costs(Univ.College:'96)=124,126,1
2-29. Researchers by major field of study and degree(Univ.& college:'96)=125,127,2
2-30 R&D exp. by industry, size of employees, source of funds, type of costs and usage(Companies:'96)=127,129,14
2-31 R&D exp. by industry, size of capital, source of funds, type of costs and usage(Companies:'96)=141,143,14
2-32. R&D exp. by industry, size of sales, source of funds, type of costs and usage(Companies:'96)=155,157,14
2-33 R&D exp. by industry, size of researchers, source of funds, type of costs and usage(Companies:'96)=169,171,14
2-34 R&D exp. by industry, size of R&D exp., source of funds, type of costs and usage(Companies:'96)=183,185,14
2-35 Type of R&D personnel engaged in R&D and annual R&D exp. per researcher by industry and size of employees(Companies:'96)=197,199,14
2-36 Type of R&D personnel engaged in R&D and annual R&D exp. per researcher by industry and size of capital(Companies:'96)=211,213,14
2-37 Type of R&D personnel engaged in R&D and annual R&D exp. per researcher by industry and size of sales(Companies:'96)=225,227,14
2-38 Type of R&D personnel engaged in R&D and annual R&D exp. per researcher by industry and size of researchers(Companies:'96)=239,241,14
2-39 Type of R&D personnel engaged in R&D and annual R&D exp. per researcher by industry and size of R&D exp. (Companies:'96)=253,255,14
2-40 R&D exp. and companies' own R&D funds as a percent of sales by industry and size of emloyees(Companies:'96)=267,269,10
2-41 R&D exp. and companies' own R&D funds as a percent of sales by industry and size of capital(Companies:'96)=227,279,10
2-42 R&D exp. and companies' own R&D funds as a percent of sales by industry and size of company(Companies:'96)=287,289,8
2-43 R&D exp. per researcher and researchers per thousand employees by industry and size of employees=295,297,10
2-44 R&D exp. per researcher and researchers per thousand employees by industry and size of capital(Companies:'96)=305,307,10
2-45 Researchers and full time eq. researchers by industry, age and sex(Companies:'96)=315,317,5
2-46 Researchers by industry and major field of study(Companies:'96)=320,322,4
2-47 Researchers by major field of study and degree(Companies:'96)=324,326,2
2-48 Researchers by industry and degree(Companies:'96)=326,328,4
2-49 Concentration rates of R&D exp. by industry(Companies:'96)=330,332,2
2-50 Concentration rates of researchers by industry(Companies:'96)=332,334,2
2-51 Concentration rates of total sales by industry(Companies:'96)=334,336,2
3. Industrial property=336,338,1
3-1 Industrial property applied and granted by right=336,338,1
3-2 Patents applied and granted by field=337,339,1
3-3 Patents applied and granted by nationality=338,340,1
4. Technological balance of payments=349,341,1
4-1 Technological balance of payments=339,341,1
4-2 Technology export=340,342,1
4-3 Foreign technology allowances and payments by nation=341,343,1
4-4 Foreign technology allowances and payments by field=342,344,2
4-5 Foreign technology allowances by nation and field(As of 1996.12.31)=344,346,1
5. Major statistics of R&D activities in selected countries=345,347,1
5-1 R&D expenditures by sector of performance, U.S.A.=345,347,1
5-2 R&D expenditures by source of funds, U.S.A=346,348,1
5-3 R&D expenditures by character of work, U.S.A=346,348,1
5-4 Researchers engaged in R&D, and per 10,000 labor force population(USA)=347,349,1
5-5 Manufacturing and nonmanufacturing R&D expenditures(USA)=347,349,1
5-6 R&D expenditures as a percent of net sales by industry(USA)=348,350,1
5-7 R&D expenditures by sector of performance, Japan=349,351,1
5-8 R&D expenditures by source of funds, Japan=349,351,1
5-9 R&D expenditures by character of work, Japan=350,352,1
5-10 Personnel engaged in R&D, Japan=350,352,1
5-11 R&D expenditures as a percent of sales by industry, Japan=351,353,1
5-12 R&D expenditures by sector of Performance, Germany=352,354,1
5-13 R&D expenditures by source of funds, Germany=353,355,1
5-14 R&D expenditures by character of work, Germany=353,355,1
5-15 Researchers by sector of performance, Germany=354,356,1
5-16 R&D expenditures and researchers by industry, Germany=354,356,1
5-17 R&D expenditures by sector of performance, France=355,357,1
5-18 R&D expenditures by ratio source of funds, France=355,357,1
5-19 Researchers by sector of performance, France=356,358,1
5-20 R&D expenditures and researchers by industry, France=356,358,1
5-21 R&D expenditures by sector of Performance, U.K=357,359,1
5-22 R&D expenditures by source of funds, U.K=357,359,1
5-23 R&D expenditures by industry, U.K.=359,360,1
5-24 Researchers by sector of performance, U.K.=359,360,1
6. General economic statistics=359,361,1
6-1 Gross national products, population, GNP deflator=359,361,1
6-2 Industrial production index, price index, export, import, current balance, foreign exchange holdings=360,362,1
6-3 GNP, GNP per capita in selected countries(current price)=361,363,1
6-4 Exchange rates=362,364,1
Appendix=363,365,45
| 등록번호 | 청구기호 | 권별정보 | 자료실 | 이용여부 |
|---|---|---|---|---|
| 0000735807 | R 607.251 ㄱ373ㄱ | 1997 | 서울관 서고(열람신청 후 정기간행물실(524호)) | 이용가능 |
| 0000735808 | R 607.251 ㄱ373ㄱ | 1997 | 부산관 서고(열람신청 후 2층 주제자료실) | 이용가능 |
*표시는 필수 입력사항입니다.
| 전화번호 |
|---|
| 기사명 | 저자명 | 페이지 | 원문 | 기사목차 |
|---|
| 번호 | 발행일자 | 권호명 | 제본정보 | 자료실 | 원문 | 신청 페이지 |
|---|
도서위치안내: / 서가번호:

우편복사 목록담기를 완료하였습니다.
*표시는 필수 입력사항입니다.
저장 되었습니다.
