
권호기사보기
| 기사명 | 저자명 | 페이지 | 원문 | 기사목차 |
|---|
| 대표형(전거형, Authority) | 생물정보 | 이형(異形, Variant) | 소속 | 직위 | 직업 | 활동분야 | 주기 | 서지 | |
|---|---|---|---|---|---|---|---|---|---|
| 연구/단체명을 입력해주세요. | |||||||||
|
|
|
|
|
|
* 주제를 선택하시면 검색 상세로 이동합니다.
[표제지 등]
제출문
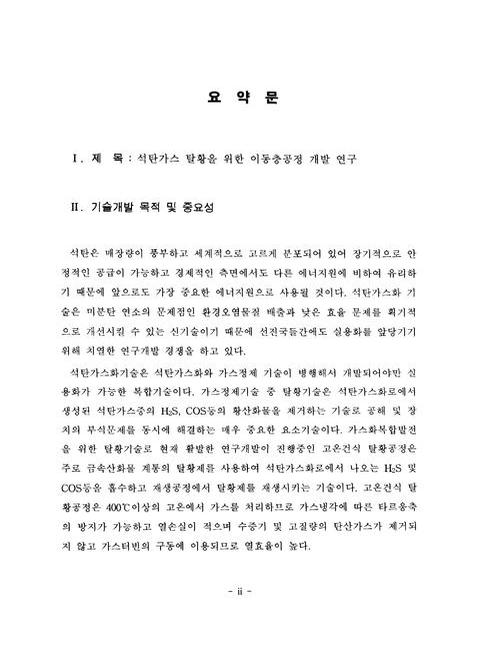
요약문
SUMMARY
목차
제1장 서론 27
제1절 연구의 배경과 필요성 27
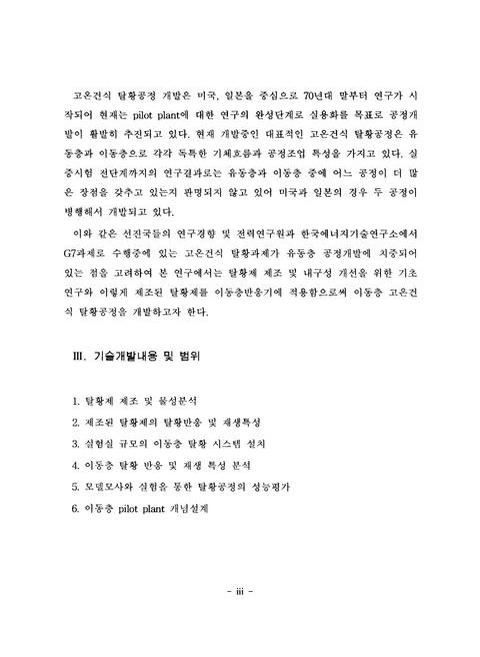
제2절 연구개발의 내용 및 범위 29
제2장 고온건식 탈황기술 현황 32
제1절 탈황제의 종류 32
제2절 탈황제의 특성 및 주요반응 34
1. 칼슘계 탈황제 34
2. 철계 탈황제 34
3. 아연계 탈황제 35
4. 동계 탈황제 38
5. 기타 탈황제 38
제3절 탈황제로 사용될 가능성이 있는 금속 40
제4절 Zinc titanate에 대한 고찰 46
1. Znic titanate의 이용 46
2. Zinc titanate의 합성 47
3. Zn/Ti 몰비에 따른 zinc titanate의 상변화 51
제5절 탈황공정의 종류 53
1. 고정층 탈황공정 53
2. 이동층 탈황공정 54
3. 유동층 탈황공정 59
제3장 탈황제의 반응특성 실험 64
제1절 탈황제 제조 및 분석 64
1. 탈황제 제조 64
2. 탈황제 분석 64
제2절 실험 장치 65
제3절 실험방법 65
제4절 실험 결과 71
1. XRD분석을 통한 zinc titanate의 결정관찰 71
가. 소성온도에 따른 결정변화 71
나. 소성시간에 따른 결정변화 75
다. Zn/Ti 몰비에 따른 결정변화 75
2. XPS분석을 통한 zinc titanate의 결정관찰 78
3. TGA에 의한 고온에서의 환원성 관찰 82
4. 소성방법에 따른 탈황제의 특성분석 87
가. Mercury Intrusion Porosimetery에 의한 탈황제의 특성분석 87
나. BET에 의한 탈황제의 특성분석 90
다. 소성방법에 따른 반응실험 95
5. Zinc titanate의 반응성 실험 98
가. Binder의 함량에 따른 탈황제의 파과특성 98
나. 반복실험을 통한 반응성 관찰 98
6. MnO₂, NiO, CuO의 첨가에 의한 zinc titanate 반응성 영향 109
제4장 이동층에서의 탈황반응 특성 119
제1절 상온 이동층 실험 119
1. 실험 장치 119
2. 실험 방법 121
3. 시료 121
4. 결과 및 고찰 124
5. Lab. scale 이동층 탈황반응기 설계 129
제2절 실험장치 및 방법 131
1. 실험 장치 131
2. 실험 방법 132
제3절 상압 이동층 실험 137
1. L/D 변화에 대한 영향 137
2. 온도에 대한 영향 137
3. 탈황제 유입속도에 대한 영향 138
4. 혼합가스 유량에 대한 영향 138
5. 첨가제 함량에 따른 반응성 139
제4절 가압 이동층 실험 149
1. L/D 변화에 대한 영향 149
2. 온도에 대한 영향 150
3. 탈황제 유입속도에 대한 영향 150
4. 혼합가스 유량에 대한 영향 151
제5장 모델모사 159
제1절 기체-고체 반응모델의 종류 159
1. Unreacted core model 159
2. Volume reaction model 161
3. Cracking core model 161
4. Nucleation model 162
5. Grain (particle-pellet) model 162
제2절 Grain model 165
1. 단일 입자에 대한 모델 166
2. 고정층에 대한 모델 175
3. 이동층에 대한 모델 181
제3절 Unreacted core model 188
제4절 여러 탈황제에 대한 황화반응 특성 및 유효확산계수 190
1. 탈황제의 종류에 따른 황화반응 특성 및 유효 확산계수 191
2. 이론에 의한 유효확산계수 계산 210
3. 모사결과 검증 및 파과곡선 예측 214
제6장 이동층 탈황공정 개념설계 219
제1절 설계기준 219
제2절 유입가스 조성 및 유량산출 221
제3절 반응기 크기 산출 226
제7장 결론 229
사용기호 232
참고문헌 236
부록 242
A.1 Estimation of gas mixture diffusivity 242
A.2 Estimation of gas mixture viscosity 244
A.3 Estimation of gas mixture density 246
A.4 Estimation of mass transfer coefficient 249
(그림 2-1) Desulfurization potential of candidate solids (I) 43
(그림 2-2) Desulfurization potential of candidate solids (II) 44
(그림 2-3) Stable solid phases 45
(그림 3-1) Experimental apparatus for fixed-bed reactor 68
(그림 3-2) The effect of calcination temperature on XRD pattern (Zn/Ti=2.0) 72
(그림 3-3) XRD pattern for Zn/Ti=1.5 73
(그림 3-4) XRD pattern for Zn/Ti=2.0 74
(그림 3-5) The effect of calcination time on XRD pattern (Zn/Ti=2.0) 76
(그림 3-6) The effect of Zn/Ti ratio on XRD pattern (Zn/Ti=2.0) 77
(그림 3-7) The XPS of O(1s) in zinc titanate 79
(그림 3-8) The XPS of Zn(2p) in zinc titanate 80
(그림 3-9) The XPS of Ti(2p1, 2p3) in zinc titanate 81
(그림 3-10) TGA profile for zinc titanate (N₂ atmosphere, Zn/Ti=1.5) 83
(그림 3-11) TGA profile for zinc titanate (N₂ atmosphere, Zn/Ti=2.0) 84
(그림 3-12) TGA profile for zinc titanate (H₂ atmosphere, Zn/Ti=1.5) 85
(그림 3-13) TGA profile for zinc titanate (H₂ atmosphere, Zn/Ti=2.0) 86
(그림 3-14) The cumulative pore volume on pore diameter (Mercury Intrusion Porosimetery) 89
(그림 3-15) The cumulative pore volume on pore diameter (BET) 92
(그림 3-16) The pore area on pore diameter 93
(그림 3-17) The incremental pore area on average pore diameter 94
(그림 3-18) The breakthrough curve of ZT-1 96
(그림 3-19) The breakthrough curve of ZT-2 97
(그림 3-20) The effect of bentonite wt% on the effluent H₂S concentration in the fixed bed 100
(그림 3-21) The effect of sulfidation-regeneration on the effluent H₂S concentration in the fixed bed(Zn/Ti=1.5, Temperature=600℃) 101
(그림 3-22) The effect of sulfidation-regeneration on the effluent H₂S concentration in the fixed bed(Zn/Ti=2.0, Temperature=600℃) 102
(그림 3-23) The effect of sulfidation-regeneration on the effluent H₂S concentration in the fixed bed(Zn/Ti=1.5, Temperature=650℃) 103
(그림 3-24) The effect of sulfidation-regeneration on the effluent H₂S concentration in the fixed bed(Zn/Ti=2.0, Temperature=650℃) 104
(그림 3-25) The effect of reaction temperature and cycle on the pore size distribution (Zn/Ti=1.5) 106
(그림 3-26) Scanning Electron Micrographs of zinc titanate (Zn/Ti=1.5) 107
(그림 3-27) The effect of MnO₂ on the effluent H₂S concentration for zinc titanate (MnO₂ 5wt%, 650℃ sulfidation, regeneration) 111
(그림 3-28) The effect of MnO₂ on the effluent H₂S concentration for zinc titanate (MnO₂ 20wt%, 650℃ sulfidation, regeneration) 112
(그림 3-29) The effect of NiO on the effluent H₂S concentration for zinc titanate (Zn/Ti=2.0) 113
(그림 3-30) The effect of sulfidation-regeneration on the effluent H₂S concentration for ZnO-CuO (1:1) 114
(그림 3-31) The effect of sulfidation-regeneration on the effluent H₂S concentration for zinc titanate (650℃, 20% CuO) 116
(그림 3-32) Comparison of zinc titanate & zinc titanate-CuO 117
(그림 3-33) The effect of sulfidation-regeneration on the effluent H₂S concentration for zinc titanate (700℃, 20%CuO) 118
(그림 4-1) Experimental apparas for cold moving bed test 120
(그림 4-2) C-curve for uniform Particles 126
(그림 4-3) F-curve for uniform Particles 127
(그림 4-4) Schematic diagram of moving-bed reactor 133
(그림 4-5) Schematic diagram of moving-bed system 134
(그림 4-6) Comparison of flow type for moving bed 135
(그림 4-7) H₂S outlet concentration when L/D=0.5 140
(그림 4-8) H₂S outlet concentration when L/D=1 141
(그림 4-9) Effect of temperature on conversion & feeding rate 142
(그림 4-10) H₂S outlet concentration for various temperature at constant feeding rate 143
(그림 4-11) Effect of solid flow rate on H₂S outlet concentration at constant gas feeding rate 144
(그림 4-12) Maximum H₂S outlet concentration & solid conversion for various solid feeding rate at constant gas flow rate 145
(그림 4-13) Effect of gas flow rate on H₂S outlet concentration (Co(이미지참조)=10000ppm, Temperature=650℃) 146
(그림 4-14) Solid feeding rate & solid conversion vs. gas flow rate for constant H₂S outlet concentration 147
(그림 4-15) H₂S outlet concentration for zinc titanate & Zn-Ti-Cu (Co=10000ppm, Qg=3500ml/min, Temperature=650℃)(이미지참조) 148
(그림 4-16) H₂S outlet concentration L/D=0.5 (5atm) 152
(그림 4-17) H₂S outlet concentration L/D=1 (5atm) 153
(그림 4-18) H₂S outlet concentration for various temmperature at constant feeding rate (5atm) 154
(그림 4-19) Effect of temperature on conversion (5atm) 155
(그림 4-20) Effect of temperature on solid feeding rate (5atm) 156
(그림 4-21) Effect of solid feeding rate on H₂S outlet concentration at constant gas feeding rate (5atm) 157
(그림 4-22) Effect of gas flow rate on H₂S outlet concentration (5atm) 158
(그림 5-1) The reaction procedure of unreacted core model 160
(그림 5-2) The reaction procedure of grain model 164
(그림 5-3) Extent of reaction versus dimensionless time (a) for a spherical particle made up of slab-like grains (b) for a spherical particle made up of cylindrical grains 171
(그림 5-4) (a) Extent of reaction versus dimensionless time for a spherical particle made up of spherical grains (b) The effect of grain shape for a spherical particle 172
(그림 5-5) Extent of reaction versus dimensionless time (a) for a slab-like particle made up of spherical grains (b) for a cylindrical particle made up of spherical grains 173
(그림 5-6) The effect of particle shape for spherical grains 174
(그림 5-7) Extent of reaction vs. position in a fixed bed reactor (a) reaction modulus=0.01 (b) reaction modulus=0.1 178
(그림 5-8) Extent of reaction vs. position in a fixed bed reactor (a) reaction modulus=1.0 (b) reaction modulus=5.0 179
(그림 5-9) Exit gas concentration vs. dimensionless time for various reaction moduli 180
(그림 5-10) Schematic diagram of a moving-bed reactor system for cocurrent and countercurrent flow 181
(그림 5-11) Extent of reaction and gaseous reactant concentration vs. position in a moving-bed reactor for zinc-based sorbent 184
(그림 5-12) Extent of reaction and gaseous reactant concentration vs. position in a moving-bed reactor for iron-based sorbent 185
(그림 5-13) Extent of reaction and gaseous reactant concentration vs. position in a moving-bed reactor for copper-based sorbent 186
(그림 5-14) (a) The effect of ratio of gas flow rate to solid flow rate (b) The comparison of flow type 187
(그림 5-15) Experimental breakthrough curves of ZnO at various temperatures vs. best-fit breakthrough curves from grain model and unreacted core model 196
(그림 5-16) Experimental breakthrough curves of Z2T at various temperatures vs. best-fit breakthrough curves from grain model and unreacted core model 197
(그림 5-17) Experimental breakthrough curves of Z2T3 at various temperatures vs. best-fit breakthrough curves from grain model and unreacted core model 198
(그림 5-18) Experimental breakthrough curves of Z3T2 at various temperatures vs. best-fit breakthrough curves from grain modet and unreacted core model 199
(그림 5-19) Experimental breakthrough curves of Z2T(20% CuO) at various temperatures vs. best-fit breakthrough curves from unreacted core model 200
(그림 5-20) Experimental breakthrough curves of Fe₂O₃ at various temperatures vs. best-fit breakthrough curves from unreacted core model 201
(그림 5-21) Experimental breakthrough curves of ZF at various temperatures vs. best-fit breakthrough curves from unreacted core model 202
(그림 5-22) Experimental breakthrough curves of ZCF(1:1:2) at various temperatures vs. best-fit breakthrough curves from unreacted core model 203
(그림 5-23) Arrhenius plots of the effective diffusivity for various sorbents from grain model 204
(그림 5-24) Arrhenius plots of the effective diffusivity for various sorbents from unreacted core model 205
(그림 5-25) Experimental breakthrough curves for various bed lengths vs. predicted breakthrough curves from grain model and unreacted core model 216
(그림 5-26) Experimental breakthrough curves for various initial concentrations vs. predicted breakthrough curves from grain model and unreacted core model 217
(그림 5-27) Experimental breakthrough curve for gas flow rate change vs. predicted breakthrough curve from grain model and unreacted core model 218
| 등록번호 | 청구기호 | 권별정보 | 자료실 | 이용여부 |
|---|---|---|---|---|
| 0000759067 | 662.62 ㅌ363ㅅ | v.3 | 서울관 서고(열람신청 후 1층 대출대) | 이용가능 |
| 0000759068 | 662.62 ㅌ363ㅅ | v.3 | 서울관 서고(열람신청 후 1층 대출대) | 이용가능 |
*표시는 필수 입력사항입니다.
| 전화번호 |
|---|
| 기사명 | 저자명 | 페이지 | 원문 | 기사목차 |
|---|
| 번호 | 발행일자 | 권호명 | 제본정보 | 자료실 | 원문 | 신청 페이지 |
|---|
도서위치안내: / 서가번호:

우편복사 목록담기를 완료하였습니다.
*표시는 필수 입력사항입니다.
저장 되었습니다.
