


권호기사보기
| 기사명 | 저자명 | 페이지 | 원문 | 기사목차 |
|---|
| 대표형(전거형, Authority) | 생물정보 | 이형(異形, Variant) | 소속 | 직위 | 직업 | 활동분야 | 주기 | 서지 | |
|---|---|---|---|---|---|---|---|---|---|
| 연구/단체명을 입력해주세요. | |||||||||
|
|
|
|
|
|
* 주제를 선택하시면 검색 상세로 이동합니다.
[표제지 등]
제출문
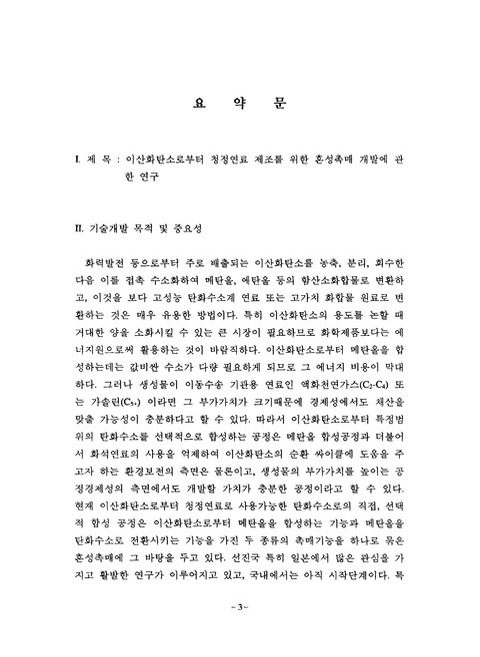
요약문
Summary
List of Figure
List of Table
목차
제1장 서론 29
제2장 문헌연구 31
제1절 메탄올 합성 31
1. 메탄올 합성공정 31
2. 메탄올 합성촉매 32
가. 메탄올 합성촉매의 역사 32
나. 촉매 활성점 34
다. 촉매 특성화 35
3. 메탄올 합성반응의 메카니즘 36
가. 반응 메카니즘 연구 36
나. 반응 Kinetics 41
제2절 메탄올 전환반응 47
1. 합성연료를 제조하기 위한 공정 49
가. Mobil 사의 MTG(Methanol to Gasoline) 공정 49
나. Topsoe(이미지참조)의 일관화된 가솔린 공정 49
다. MTO(Methanol to Olefin) 공정 50
라. Ethanol to Gasoline 52
마. Integrated Fischer-Tropsch/Zeolite 공정 52
2. 반응 메카니즘 53
3. 촉매 및 생성물 분포 56
4. 제올라이트 57
가. 제올라이트와 분자체 57
나. 분류와 구조 58
다. 제올라이트의 합성 63
제3절 혼성촉매를 이용한 탄화수소의 직접합성 71
제3장 실험 73
제1절 메탄올 합성 73
1. 촉매의 제조 및 특성분석 73
가. 촉매 제조 73
나. 촉매 특성분석 75
2. 반응실험 75
3. 메커니즘 분석 79
제2절 메탄올 전환 80
1. 촉매의 제조 및 특성분석 80
가. 촉매 제조 80
나. 촉매의 특성분석 83
2. 반응실험 85
가. 반응 실험장치 85
나. 반응 실험방법 85
제3절 혼성촉매 88
1. 혼성촉매의 제조 88
2. 반응실험 88
제4장 결과 및 고찰 89
제1절 메탄올 합성반응 89
1. 촉매 특성분석 89
가. 촉매 표면적 89
나. X-선 회절 분석 93
2. 반응실험 결과 103
3. 메커니즘 분석 - I 122
가. 온도에 따른 영향 122
나. 시간에 따른 영향 128
4. 메커니즘 분석 - II 130
가. 기상 생성물의 변화 132
나. Transmission FT-IR을 이용한 반응 중간체 연구 139
제2절 메탄올 전환반응 146
1. 촉매 특성분석 146
가. X선 회절 분석 146
나. 주사 전자 현미경[원문불량;p.150~151] 146
다. 암모니아 TPD 154
라. FT-IR 154
2. 반응실험 결과 162
가. 촉매의 구조에 따른 반응성 162
나. 반응 온도에 따른 영향 166
다. 반응 시간에 따른 활성 변화 171
라. 열처리에 의한 활성 변화 179
제3절 혼성촉매를 이용한 탄화수소의 직접합성 181
1. 혼성촉매의 반응 활성 181
가. Cu/ZnO/ZrO₂+ MFI 계로 이루어진 혼성촉매 181
나. Cu/ZnO/ZrO₂+ SAPO 계로 이루어진 혼성촉매 183
다. Cu/ZnO/Ga₂O₃+ zeolite 계로 이루어진 혼성촉매 183
2. 온도에 따른 반응 활성 183
가. Cu/ZnO/ZrO₂+ MFI 계로 이루어진 혼성촉매 183
나. Cu/ZnO/ZrO₂+ SAPO 계로 이루어진 혼성촉매 190
3. 압력에 의한 영향 190
4. 산량에 따른 영향 197
5. 신촉매 활성 성분 조사 197
6. 비활성화 연구 209
7. 촉매층 배열의 영향 209
8. 탄화수소 직접합성반응의 반응경로 해석[원문불량;p.215] 215
9. 최적 혼성촉매의 선정 221
제5장 결론 223
제1절 메탄올 합성반응 223
제2절 메탄올 전환반응 223
제3절 혼성촉매를 이용한 탄화수소의 직접합성 224
제6장 참고문헌 225
Fig. 1. Rake mechanism 55
Fig. 2. Carbon pool mechanism 55
Fig. 3. Perspective view of ZSM-5 structure 64
Fig. 4. Perspective view of AlPO₄-5 structure 65
Fig. 5. Perspective view of SAPO-34(chabazite) 66
Fig. 6. Framework structure of SAPO-34(CHA) and AlPO₄-18(AEI) 67
Fig. 7. Schematic diagram of apparatus for FEAG process 74
Fig. 8. Schematic diagram of apparatus for CO₂ hydrogenation 76
Fig. 9. Schematic diagram of stainless-steel reactor 77
Fig. 10. Schematic diagram of apparatus for NH₃ TPD 84
Fig. 11. Schematic diagram of the in-situ FTIR cell 86
Fig. 12. Schematic diagram of apparatus for methanol conversion reaction 87
Fig. 13. XRD patterns of CuO/ZrO₂ catalysts; precursors, Cu acetate and Zr nitrate 98
Fig. 14. XRD patterns of CuO/ZrO₂/MexOy(이미지참조) ternary catalysts 99
Fig. 15. XRD patterns of CuO/ZnO/Al₂O₃(60:30:10 wt%) and CuO/ZnO/Cr₂O₃(60:30:10 wt% ) 100
Fig. 16. XRD patterns of CuO/ZrO₂/ZnO catalysts; 60 wt% CuO 101
Fig. 17. XRD patterns of CuO/ZrO₂/ZnO catalysts; constant CuO/ZrO₂ ratio(80:20 wt%) 102
Fig. 18. Catalytic behavior according to time on stream; cat., CuO/ZrO₂/ZnO(80:20:20 wt%); temp., 250℃; press., 22atm; W/F, 2.07 g-cat. hr/mol 104
Fig. 19. Influence of CuO content on catalytic behaviors of CuO/ZrO₂ binary catalysts; temp., 250℃; press., 22atm; W/F, 2.07 g-cat.·hr/mol 108
Fig. 20. Influence of temperature on catalytic behaviors of CuO/ZrO₂(80:20 wt%) catalysts synthesized from different Cu precursors; press., 22atm; W/F, 2.07 g-cat.·hr/mol 109
Fig. 21. Dependence of catalytic behavior on Cu surface area over CuO/ZrO₂ binary catalysts; temp., 250℃; press., 22atm; W/F, 2.07 g-cat.·hr/mol 113
Fig. 22. Methanol yield vs. Cu surface area; CuO/ZrO₂/MexOy(이미지참조) ternary catalysts; temp., 250℃; press., 22atm; W/F, 2.07 g-cat.·hr/mol 114
Fig. 23. Influence of the addition of ternary component on catalytic behavior of CuO/ZrO₂/MexOy(이미지참조) catalysts; temp., 250℃; press., 22atm; W/F, 2.07 g-cat.·hr/mol 115
Fig. 24. Dependence of catalytic behavior on temperature over CuO/ZrO₂/MexOy(이미지참조) ternary catalysts; press., 22atm; W/F, 2.07 g-cat.·hr/mol 116
Fig. 25. Catalytic behaviors of CuO/ZnO/Al₂O₃(60:30:10 wt%) and CuO/ZnO/Cr₂O₃(60:30:10 wt%); press., 22atm; W/F, 2.07 g-cat.·hr/mol 117
Fig. 26. Catalytic behavior of CuO/ZnO/Ga₂O₃(60:30:10 wt%) according to time on stream 119
Fig. 27. Influence of ZnO/ZrO₂ ratio on catalytic behavior of CuO/ZrO₂/ZnO catalyst with constant CuO content; 60wt% CuO; temp., 250℃; press., 22atm; W/F, 2.07 g-cat.·hr/mol 120
Fig. 28. Influence of ZnO addition on the catalytic behavior of CuO/ZrO₂/ZnO catalyst with constant CuO/ZrO₂ ratio (80:20 wt%); temp., 250℃; press., 22atm, W/F, 2.07 g-cat.· hr/mol 121
Fig. 29. Dependence of catalytic behavior on pressure; cat., CuO/ZrO₂/ZnO(80:20:40 wt%); temp. 250℃; W/F, 2.07 g-cat.·hr/mol 123
Fig. 30. Influence of contact time(W/F) on catalytic behavior; cat., CuO/ZrO₂/ZnO(80:20:40 wt%); temp., 250℃;press., 22atm 124
Fig. 31. FTIR spectra during CO₂ hydrogenation over Cu/SiO₂ catalyst at 35℃ and 1 atm 125
Fig. 32. FTIR spectra during CO₂ hydrogenation over Cu/SiO₂ catalyst under 1 atm at (a) 35℃ (b) 55℃ (c) 75℃ (d) 85℃ (e) 95℃ 126
Fig. 33. FTIR spectra during CO₂ hydrogenation over Cu/SiO₂ catalyst under 1 atm at (a) 120℃ (b) 140℃ (c) 160℃ (d) 180℃ (e) 240℃ 127
Fig. 34. Mass spectra during CO₂ hydrogenation over Cu/SiO₂ catalyst for 60 min 129
Fig. 35. FTIR spectra during CO₂ hydrogenation over Cu/SiO₂ catalyst under 1 atm and 140℃ for (a) 1 min (b) 3 min (c) 6 min (d) 10 min (e) 20 min (f) 40 min 131
Fig. 36. CO₂ conversion and CH₃OH yield over CuO/ZrO₂(7:93 wt%) catalyst according to temperature 133
Fig. 37. CH₃OH selectivity over CuO/ZrO₂(7:93 wt%) catalyst according to temperature 134
Fig. 38. CO₂ conversion and CH₃OH yield over CuO/ZnO/ZrO₂(7:3:90 wt%) catalyst according to temperature 135
Fig. 39. CH₃OH selectivity over CuO/ZnO/ZrO₂(7:3:90wt%) catalyst according to temperature 136
Fig. 40. Turnover frequencies of methanol synthesis reaction and net amount of reverse water gas shift reaction over CuO/ZrO₂(7:93 wt%) catalyst according to temperature 137
Fig. 41. Turnover frequencies of methanol synthesis reaction and net amount of reverse water gas shift reaction over CuO/ZnO/ZrO₂(7:3:90 wt%) catalyst according to temperature 138
Fig. 42. Turnover frequencies of methanol synthesis reaction and net amount of reverse water gas shift reaction over CuO/ZrO₂(7:93 wt%) catalyst according to time on stream 140
Fig. 43. Turnover frequencies of methanol synthesis reaction and net amount of reverse water gas shift reaction over CuO/ZnO/ZrO₂(7:3:90 wt%) catalyst according to time on stream 141
Fig. 44. IR spectrum during CO₂ hydrogenation over Cu/ZrO₂(7:93 wt% ) catalyst at 260 ℃ 142
Fig. 45. IR spectra during CO₂ hydrogenation over Cu/ZrO₂(7:93 wt%) catalyst at (a) 30 ℃ (b) 70 ℃ (c) 260 ℃ 144
Fig. 46. IR spectra during CO₂ hydrogenation over Cu/ZrO₂(7:93 wt%) catalyst at (a) 30 ℃ (b) 70 ℃ (c) 260 ℃ 145
Fig. 47. X-ray diffraction pattern of MFI-type catalysts a)ZSM-5, b)Fe-silicate, c)Ga-silicate, d)Zn-silicate 147
Fig. 48. X-ray diffraction pattern of SAPO-5 148
Fig. 49. X-ray diffraction pattern of SAPO-18 148
Fig. 50. X-ray diffraction pattern of SAPO-34 149
Fig. 51. X-ray diffraction pattern of SAPO-44 149
Fig. 52. X-ray diffraction pattern of MFI-type catalysts before and after heat treatment: calcination at 725℃ for 2hours a)ZSM-5, b)Fe-silicate, c)Ga-silicate, d)Zn-silicate Before treatment: bottom, After treatment: top 150
Fig. 53. X-ray diffraction pattern of SAPOs before and after heat treatment: calcination at 725℃ for 2hours a)SAPO-18, b)SAPO-34, c)SAPO-44 Before treatment: bottom, After treatment: top 151
Fig. 54. SEM images of MFI-type catalysts a)ZSM-5, b)Fe-silicate, c)Ga-silicate, d)Zn-silicate[원문불량;p.150] 152
Fig. 55. SEM images of SAPOs a)SAPO-5, b)SAPO-18, c)SAPO-34, d)SAPO-44[원문불량;p.151] 153
Fig. 56. NH₃ TPD of MFI-type catalysts 155
Fig. 57. NH₃ TPD of SAPO-18 156
Fig. 58. NH₃ TPD of SAPO-5 with different SiO₂/Al₂O₃ 157
Fig. 59. NH₃ TPD of SAPO-34 with different SiO₂/Al₂O₃ 158
Fig. 60. NH₃ TPD of SAPO-44 with different crystallization time 159
Fig. 61. Framework IR spectra(sepctra) of SAPO-5 and SAPO-44 160
Fig. 62. Framework IR spectra(sepctra) of HZSM-5 and H-Ga-Silicate 161
Fig. 63. FT-IR spectra of zeolites following pyridine adsorption and desorption at 150℃ 163
Fig. 64. Conversion with temperature over HZSM-5, metallosilicates and SAPOs 168
Fig. 65. Lower olefins selectivity with temperature over HZSM-5, metallosilicates and SAPOs 169
Fig. 66. Lower olefins and aromatics selectivity with temperature over HZSM-5 170
Fig. 67. Lower olefins and aromatics selectivity with temperature over Fe-silicate 172
Fig. 68. Lower olefins and aromatics selectivity with temperature over Ga-silicate 173
Fig. 69. Lower olefins and aromatics selectivity with temperature over SAPO-5 174
Fig. 70. Lower olefins selectivity with temperature over SAPO-18 175
Fig. 71. Lower olefins selectivity with temperature over SAPO-34 176
Fig. 72. Lower olefins selectivity with temperature over SAPO-44 177
Fig. 73. Conversion with time-on-stream over various catalysts 178
Fig. 74. Conversion with time-on-stream over heat-treated catalysts(catalyst s) 180
Fig. 75. Effect of temperature on CO₂ hydrogenation over hybrid catalyst composed of Cu/ZnO/ZrO₂ and HZSM-5; Pressure: 28atm., H₂/CO₂: 3, W/F: 20g-cat.h/mol 186
Fig. 76. Effect of temperature on CO₂ hydrogenation over hybrid catalyst composed of Cu/ZnO/ZrO₂ and Ga-Silicate; Pressure: 28atm., H₂/CO₂: 3, W/F:20g-cat.h/mol 187
Fig. 77. Effect of temperature on CO₂ hydrogenation over hybrid catalyst composed of Cu/ZnO/Ga₂O₃ and HZSM-5; Pressure: 28atm., H₂/CO₂: 3, W/F: 20g-cat.h/mol 188
Fig. 78. Effect of temperature on CO₂ hydrogenation over hybrid catalyst composed of Cu/ZnO/ZrO₂ and Fe-Silicate; Pressure: 28atm., H₂/CO₂: 3, W/F: 20g-cat.h/mol 189
Fig. 79. Effect of temperature on CO₂ hydrogenation over hybrid catalyst composed of Cu/ZnO/ZrO₂ and SAPO-5; Pressure: 28atm., H₂/CO₂: 3, W/F: 20g-cat.h/mol 191
Fig. 80. Effect of temperature on CO₂ hydrogenation over hybrid catalyst composed of Cu/ZnO/ZrO₂ and SAPO-34; Pressure: 28atm., H₂/CO₂: 3, W/F: 20g-cat.h/mol 192
Fig. 81. Effect of temperature on CO₂ hydrogenation over hybrid catalyst composed of Cu/ZnO/ZrO₂ and SAPO-44; Pressure: 28atm., H₂/CO₂: 3, W/F: 20g-cat.h/mol 193
Fig. 82. Effect of temperature on CO₂ hydrogenation over Cu/ZnO/ZrO₂ Pressure: 28atm., H₂/CO₂: 3, W/F: 20g-cat.h/mol 194
Fig. 83. Effect of temperature on methanol conversion over SAPO-5; Pressure: 1atm., W/F: 20g-cat.h/mol, methanol/He: 1/17 195
Fig. 84. Effect of pressure on CO₂ hydrogenation over hybrid catalyst composed of Cu/ZnO/Ga₂O₃ and SAPO-34; Pressure: 28atm., H₂/CO₂: 3, W/F: 20g-cat.h/mol 196
Fig. 85. NH₃ TPD of hybrid catalyst composed of Cu/ZnO/ZrO₂ and SAPO-34 201
Fig. 86. NH₃ TPD of hybrid catalyst composed of Cu/ZnO/ZrO₂ and HZSM-5 202
Fig. 87. NH₃ TPD of hybrid catalysts 203
Fig. 88. Effect of mixing ratio on CO₂ hydrogenation over hybrid catalyst composed of Cu/ZnO/ZrO₂ and SAPO-34; Pressure : 28atm, H₂/CO₂:3, W/F :20g.cat.h/mol. 205
Fig. 89. Effect of time-on-stream on CO₂ hydrogenation over hybrid catalyst composed of Cu/ZnO/ZrO₂ and SAPO-34;Pressure : 28atm, H₂/CO₂: 3, W/F:20g-cat.h/mol 206
Fig. 90. NH₃ TPD of hybrid catalyst composed of Cu/ZnO/ZrO₂ and SAPO-34 with mixing ratio 210
Fig. 91. NH₃ TPD of hybrid catalysts composed of Cu/ZnO/ZrO₂ and SAPO-34 with timeonstream 212
Fig. 92. Effect of time-on-stream on CO₂ hydrogenation over hybrid catalyst composed of Cu/ZnO/ZrO₂(FEAG method) and SAPO-34;Pressure:28atm, H₂/CO₂: 3, W/F:20g-cat.h/mol 213
Fig. 93. Reaction mechanisms of methanol conversion 220
| 등록번호 | 청구기호 | 권별정보 | 자료실 | 이용여부 |
|---|---|---|---|---|
| 0000759079 | 665.89 ㅌ363ㅇ | 서울관 서고(열람신청 후 1층 대출대) | 이용가능 | |
| 0000759080 | 665.89 ㅌ363ㅇ | 서울관 서고(열람신청 후 1층 대출대) | 이용가능 |
*표시는 필수 입력사항입니다.
| 전화번호 |
|---|
| 기사명 | 저자명 | 페이지 | 원문 | 기사목차 |
|---|
| 번호 | 발행일자 | 권호명 | 제본정보 | 자료실 | 원문 | 신청 페이지 |
|---|
도서위치안내: / 서가번호:

우편복사 목록담기를 완료하였습니다.
*표시는 필수 입력사항입니다.
저장 되었습니다.
