
 대표어
대표어


권호기사보기
| 기사명 | 저자명 | 페이지 | 원문 | 기사목차 |
|---|
결과 내 검색
동의어 포함
목차
[표제지 등]=0,1,2
머리말=1,3,2
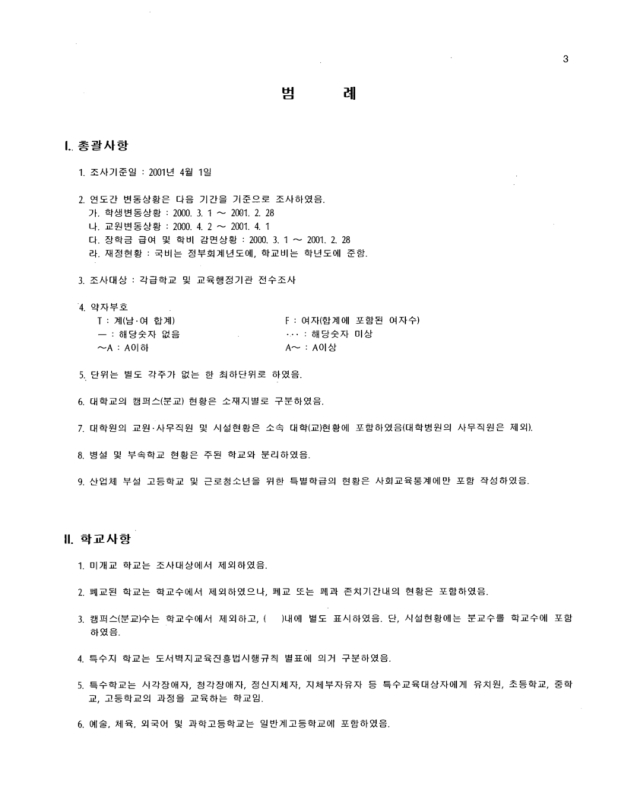
범례=3,5,8
차례=11,13,10
I. 학교기본통계=21,23,2
1. 각급학교개황=23,25,1
1-1. 학교총개황=24,26,2
1-2. 학교현황=26,28,2
1-3. 학생현황=28,30,2
1-4. 시설현황=30,32,2
1-5. 교원현황=32,34,1
1-6. 사무직원현황=33,35,1
1-7. 학급및학과현황=34,36,1
2. 유치원현황=35,37,1
2-1. 유치원개황=36,38,2
2-2. 설립별유치원수=38,40,1
2-3. 원아수별유치원수=38,40,1
2-4. 연령별원아수=39,41,1
2-5. 직위별교원수=40,42,2
2-6. 자격별교원수=42,44,2
2-7. 경력년수별교원수=44,46,2
2-8. 학력년수별교원수=46,48,2
2-9. 소지자격취득후경과년수별교원수=48,50,2
2-10. 소지자격별연수이수교원수=50,52,2
2-11. 연령별교원수=52,54,2
2-12. 호봉별교원수=54,56,4
2-13. 주택별교원수=58,60,2
2-14. 교원동태=60,62,2
2-15. 학교용지=62,64,2
2-16. 교사용도별면적=64,66,1
2-17. 구조별건물동수=65,67,1
2-18. 구조별건물면적=66,68,2
2-19. 에너지사용량=68,70,1
2-20. 냉난방면적=69,71,1
2-21. 사무직원수=70,72,1
3. 초등학교현황=71,73,1
3-1. 초등학교개황=72,74,2
3-2. 학급수별학교수=74,76,2
3-3. 아동수별학교수=76,78,1
3-4. 학급편제방식별학급수=76,78,2
3-5. 특수지공립초등학교현황=78,80,4
3-6. 아동수별학급수=82,84,1
3-7. 2부제수업학급수=82,84,1
3-8. 아동변동상황=83,85,1
3-9. 학년별학급수및아동수=84,86,2
3-10. 학년및연령별아동수=86,88,4
3-11. 졸업자의진학상황=90,92,2
3-12. 직위별교원수=92,94,2
3-13. 자격별교원수=94,96,2
3-14. 경력년수별교원수=96,98,2
3-15. 학력년수별교원수=98,100,2
3-16. 소지자격취득후경과년수별교원수=100,102,2
3-17. 소지자격별연수이수교원수=102,104,2
3-18. 연령별교원수=104,106,2
3-19. 호봉별교원수=106,108,4
3-20. 주택별교원수=110,112,2
3-21. 교원동태=112,114,2
3-22. 출신학교별교원수=114,116,1
3-23. 의무교육적령아동취학상황=115,117,1
3-24. 학교용지=116,118,2
3-25. 교사용도별면적=118,120,1
3-26. 구조별건물동수=119,121,1
3-27. 구조별건물면적=120,122,2
3-28. 에너지사용량=122,124,1
3-29. 냉난방면적=123,125,1
3-30. 복식학급 및 단급 학교수=124,126,1
3-31. 컴퓨터보유현황=125,127,1
3-32. 사무직원수=126,128,1
4. 중학교현황=127,129,1
4-1. 중학교개황=128,130,5
4-2. 체육중학교현황=133,135,1
4-3. 학급수별학교수=134,136,2
4-4. 학생수별학교수=136,138,1
4-5. 학생수별학급수=137,139,1
4-6. 특수지공립중학교현황=138,140,4
4-7. 학년및연령별학생수=142,144,2
4-8. 학생변동상황=144,146,1
4-9. 입학상황=144,146,2
4-10. 졸업자의진학상황=146,148,2
4-11. 장학금급여및학비감면자수=148,150,2
4-12. 장학금급여및학비감면액=150,152,2
4-13. 선택교과목개설현황=152,154,2
4-14. 직위별교원수=154,156,4
4-15. 자격별교원수=158,160,2
4-16. 경력년수별교원수=160,162,2
4-17. 학력년수별교원수=162,164,2
4-18. 소지자격취득후경과년수별교원수=164,166,2
4-19. 소지자격별연수이수교원수=166,168,2
4-20. 담당과목별교원수 I=168,170,3
4-21. 담당과목별교원수 II=171,173,3
4-22. 연령별교원수=174,176,2
4-23. 주당수업시간별교원수=176,178,2
4-24. 호봉별교원수=178,180,4
4-25. 주택별교원수=182,184,2
4-26. 교원동태=184,186,2
4-27. 출신별자격증과목별교원수=186,188,3
4-28. 자격증과목별퇴직교원수=189,191,3
4-29. 학교용지=192,194,2
4-30. 교사용도별면적=194,196,1
4-31. 구조별건물동수=195,197,1
4-32. 구조별건물면적=196,198,2
4-33. 에너지사용량=198,200,1
4-34. 냉난방면적=199,201,1
4-35. 컴퓨터보유현황=200,202,1
5. 고등학교현황=201,203,1
5-1. 고등학교개황=202,204,4
5-2. 학급수별학교수=206,208,2
5-3. 특수지공립고등학교현황=208,210,4
5-4. 학생수별학교수=212,214,1
6. 일반계고등학교현황=213,215,1
6-1. 일반계고등학교개황=214,216,4
6-2. 예술고등학교현황=218,220,4
6-3. 체육고등학교현황=222,224,4
6-4. 과학고등학교현황=226,228,4
6-5. 외국어고등학교현황=230,232,4
6-6. 학급수별학교수=234,236,2
6-7. 학생수별학교수=236,238,1
6-8. 학생수별학급수=237,239,1
6-9. 학년및연령별학생수=238,240,2
6-10. 학생변동상황=240,242,2
6-11. 입학상황=242,244,2
6-12. 졸업자의진학상황=244,246,2
6-13. 졸업자의진로및취업상황=246,248,4
6-14. 장학금급여및학비감면자수=250,252,2
6-15. 장학금급여및학비감면액=252,254,2
6-16. 종합고등학교보통과현황=254,256,3
6-17. 보통교과과정현황=257,259,3
6-18. 제2외국어교과목개설현황=260,262,2
6-19. 실업가정교과목개설현황=262,264,2
6-20. 교양선택교과목개설현황=264,266,2
6-21. 직위별교원수=266,268,4
6-22. 자격별교원수=270,272,2
6-23. 경력년수별교원수=272,274,2
6-24. 학력년수별교원수=274,276,2
6-25. 소지자격취득후경과년수별교원수=276,278,2
6-26. 소지자격별연수이수교원수=278,280,2
6-27. 담당과목별교원수 I=280,282,3
6-28. 담당과목별교원수 II=283,285,3
6-29. 연령별교원수=286,288,2
6-30. 주당수업시간별교원수=288,290,2
6-31. 호봉별교원수=290,292,4
6-32. 주택별교원수=294,296,2
6-33. 교원동태=296,298,2
6-34. 출신별자격증과목별교원수=298,300,3
6-35. 자격증과목별퇴직교원수=301,303,3
6-36. 학교용지=304,306,2
6-37. 교사용도별면적=306,308,1
6-38. 구조별건물동수=307,309,1
6-39. 구조별건물면적=308,310,2
6-40. 에너지사용량=310,312,1
6-41. 냉난방면적=311,313,1
6-42. 컴퓨터보유현황=312,314,1
7. 실업계고등학교현황=313,315,1
7-1. 실업계고등학교개황=314,316,4
7-2. 농업고등학교현황=318,320,4
7-3. 공업고등학교현황=322,324,4
7-4. 상업고등학교현황=326,328,4
7-5. 수산및해양고등학교현황=330,332,4
7-6. 실업고등학교현황=334,336,4
7-7. 종합고등학교현황=338,340,4
7-8. 학급수별학교수=342,344,2
7-9. 학생수별학교수=344,346,1
7-10. 학생수별학급수=345,347,1
7-11. 학년및연령별학생수=346,348,2
7-12. 과정별학생수=348,350,44
7-13. 학생변동상황=392,394,2
7-14. 장학금급여및학비감면자수=3094,396,2
7-15. 장학금급여및학비감면액=396,398,2
7-16. 졸업자의진학상황=398,400,2
7-17. 졸업자의진로및취업상황=400,402,30
7-18. 입학상황=430,432,2
7-19. 제2외국어교과목개설현황=432,434,2
7-20. 직위별교원수=434,436,4
7-21. 자격별교원수=438,440,2
7-22. 경력년수별교원수=440,442,2
7-23. 학력년수별교원수=442,444,2
7-24. 소지자격취득후경과년수별교원수=444,446,2
7-25. 소지자격별연수이수교원수=446,448,2
7-26. 담당과목별교원수 I=448,450,7
7-27. 담당과목별교원수 II=455,457,7
7-28. 연령별교원수=462,464,2
7-29. 주당수업시간별교원수=464,466,2
7-30. 호봉별교원수=466,468,4
7-31. 주택별교원수=470,472,2
7-32. 교원동태=472,474,2
7-33. 출신별자격증과목별교원수=474,476,7
7-34. 자격증과목별퇴직교원수=481,483,7
7-35. 학교용지=488,490,2
7-36. 교사용도별면적=490,492,1
7-37. 구조별건물동수=491,493,1
7-38. 구조별건물면적=492,494,2
7-39. 에너지사용량=494,496,1
7-40. 냉난방면적=495,497,1
7-41. 컴퓨터보유현황=496,498,1
8. 특수학교현황=497,499,1
8-1. 특수학교개황=498,500,2
8-2. 수용대상별학교수=500,502,1
8-3. 연령별학생수=500,502,2
8-4. 학년별학급수및학생수=502,504,1
8-5. 졸업자의진로및취업상황(고등학교과정)=502,504,2
8-6. 수용대상별학생수=504,506,1
8-7. 사무직원수=505,507,1
8-8. 직위별교원수=506,508,2
8-9. 자격별교원수=508,510,2
8-10. 경력년수별교원수=510,512,2
8-11. 학력년수별교원수=512,514,2
8-12. 연령별교원수=514,516,2
8-13. 주택별교원수=516,518,2
8-14. 교원동태=518,520,2
8-15. 호봉별교원수=520,522,4
8-16. 학교용지=524,526,2
8-17. 교사용도별면적=526,528,1
8-18. 구조별건물동수=527,529,1
8-19. 구조별건물면적=528,530,2
8-20. 에너지사용량=530,532,1
8-21. 냉난방면적=531,533,1
8-22. 주요교구=532,534,1
9. 기타학교현황=533,535,1
9-1. 공민학교개황=534,536,4
9-2. 고등공민학교개황=538,540,4
9-3. 고등기술학교개황=542,544,4
9-4. 각종학교(중학교)개황=546,548,4
9-5. 각종학교(고교)개황=550,552,4
9-6. 연령별학생수=554,556,8
9-7. 분야별학생수=562,564,4
9-8. 학생변동상황=566,568,1
9-9. 검정고시상황=567,569,1
9-10. 졸업자의진학상황=567,569,1
9-11. 졸업자의 진로 및 취업상황=568,570,6
9-12. 자격별교원수=574,576,2
9-13. 호봉별교원수=576,578,4
9-14. 주택별교원수=580,582,2
9-15. 학교용지=582,584,2
9-16. 교사용도별면적=584,586,1
9-17. 구조별건물동수=585,587,1
9-18. 구조별건물면적=586,588,2
9-19. 에너지사용량=588,590,1
9-20. 냉난방면적=589,591,1
9-21. 사무직원수=590,592,1
10. 방송통신고등학교현황=591,593,1
10-1. 방송통신 고등학교 설치 운영 현황=592,594,1
11. 고등교육기관현황=593,595,1
11-1. 고등교육기관개황=594,596,12
11-2. 재적외국인학생수=606,608,2
11-3. 장학금급여및학비감면자수=608,610,2
11-4. 졸업자의 진로 및 취업상황=610,612,15
11-5. 졸업자의진학상황=625,627,1
11-6. 직위별교원수=626,628,2
11-7. 학위별교원수=628,630,2
11-8. 전공계열별교원수=630,632,2
11-9. 연령별교원수=632,634,2
11-10. 경력연수별교원수=634,636,2
11-11. 주당수업시간별교원수=636,638,2
11-12. 호봉별교원수=638,640,2
11-13. 교원동태=640,642,2
11-14. 사무직원수=642,644,4
11-15. 국적별 외국인 교원수=646,648,1
11-16. 구조별건물면적=647,649,5
11-17. 교사용도별면적=652,654,2
11-18. 학교용지=654,656,6
11-19. 도서관현황=660,662,1
12. 전문대학현황=661,663,1
12-1. 전문대학개황=662,664,4
12-2. 학과별학생수=666,668,34
12-3. 연령별학생수=700,702,2
12-4. 입학상황(지원자, 입학자)=702,704,2
12-5. 학생변동상황=704,706,1
13. 교육대학현황=705,707,1
13-1. 교육대학개황=706,708,1
13-2. 연령별학생수=706,708,2
13-3. 입학상황=708,710,1
13-4. 학생변동상황=708,710,1
14. 대학교현황=709,711,1
14-1. 대학교개황=710,712,4
14-2. 학과별학생수=714,716,66
14-3. 연령별학생수=780,782,2
14-4. 입학상황(지원자, 입학자)=782,784,2
14-5. 학생변동상황=784,786,1
15. 대학원현황=785,787,1
15-1. 대학원개황=786,788,4
15-2. 일반대학원현황=790,792,4
15-3. 전문ㆍ특수대학원 현황=794,796,9
15-4. 연령별학생수=803,805,1
15-5. 학과별학생수=804,806,58
15-6. 박사및명예박사학위수여상황=862,864,2
15-7. 학생변동상황(중퇴자수)=864,866,1
16. 각종학교현황=865,867,1
16-1. 각종학교개황=866,868,4
16-2. 학과별학생수=870,872,4
16-3. 연령별학생수=874,876,2
16-4. 입학상황=876,878,2
16-5. 학생변동상황=878,880,1
17. 방송통신대학현황=879,881,1
17-1. 방송통신대학개황=880,882,1
17-2. 연령별학생수=880,882,1
17-3. 직업별학생수=881,883,1
17-4. 학과별학생수=882,884,2
18. 산업대학현황=884,886,1
18-1. 산업대학개황=885,887,1
18-2. 연령별 신ㆍ편입학생수=885,887,1
18-3. 직업별 신ㆍ편입학생수=885,887,1
18-4. 학교별학생수=886,888,2
19. 기술대학현황=888,890,1
19-1. 기술대학개황=888,890,1
19-2. 연령별학생수=888,890,1
19-3. 학과별학생수=888,890,2
20. 재외동포교육기관현황=890,892,1
20-1. 재외한국학교현황=891,893,1
20-2. 재외한글학교현황=892,894,1
20-3. 재일한국교육원현황=893,895,1
20-4. 북남미 및 구주지역 한국교육원 현황=893,895,1
20-5. 해외주재교육관현황=894,896,1
20-6. 해외파견교육공무원현황=894,896,1
21. 사설학원현황=895,897,1
21-1. 사설학원개황=896,898,1
21-2. 시설현황=896,898,1
21-3. 이수기간별 직업별 수강자수=897,899,3
21-4. 직업별학력별수강자수=900,902,2
21-5. 직업별학력별이수자수=902,904,2
21-6. 이수기간별직업별이수자수=904,906,3
II. 주요업무통계=907,909,2
교육행정=909,911,1
1-1. 정현원표=909,911,3
1-2. 법인현황=912,914,1
1-3. 교원자격증발급현황=913,915,1
1-4. 자격연수실적(2000년도)=913,915,1
1-5. 교원연수현황(2000.3 - 2001.2)=914,916,2
1-6. 교과서발행현황=916,918,1
1-7. 교과용도서무상지급현황=916,918,1
1-8. 대학수학능력시험실시현황=917,919,1
1-9. 장학선보유현황=917,919,1
1-10. 학술원상수여현황=917,919,1
1-11. 국비유학생선발 및 파견현황=918,920,1
1-12. 정부(교육부) 장학금에 의한 외국인 학생 초청 실적 및 수학현황=918,920,1
1-13. 학교급식실시상황(2000년도)=919,921,1
1-14. 각 시ㆍ도 교육연구원 및 지역교육청 보유 주요 시청각 기ㆍ교재 현황=920,922,2
교육재정=922,924,1
2-1. FY 2001 정부예산 규모 대 교육부 예산=922,924,1
2-2. 연도별 정부 예산 대 교육부 예산=923,925,1
2-3. FY 2001 교육부소관세입예산=924,926,1
2-4. FY 2001 교육부소관세출예산=925,927,1
2-5. FY 2001 교육부소관 세출예산 목별 분류=926,928,2
2-6. FY 2000 교육부소관 세입예산 및 결산=928,930,2
2-7. FY 2000 교육부소관 세출예산 및 결산=930,932,2
2-8. FY 2000 교육부예비비사용내역=932,934,1
2-9. FY 2000 실험실습비(국고) 보조현황=932,934,1
2-10. FY 2001 국립학교 교육비 분류=933,935,1
2-11. FY 2001 공립학교 교육비 분류(지방교육비)=933,935,1
2-12. FY 2001 지방교육비 세입세출 예산(교육비 특별회계)=934,936,3
2-13. FY 2000 지방교육비 세입세출 결산(교육비 특별회계)=937,939,3
2-14. FY 2001 지방교육비 특별회계 세출예산 성질별 분류=940,942,1
2-15. 연도별 지방교육비 특별회계 재원 내역=941,943,1
2-16. 학교법인예산및결산(초ㆍ중등교육기관)=942,944,2
2-17. 학교법인예산및결산자금운용현황(고등교육기관)=944,946,2
2-18. FY 2001 기성(육성)회 세입세출예산=946,948,2
2-19. FY 2000 기성(육성)회 세입세출결산=948,950,2
2-20. FY 2000 학술연구조성비지원현황=950,952,1
2-21. 국유재산현황=950,952,2
2-22. FY 2001 각급학교 납입금 징수액 현황(1인당 연액)=952,954,1
2-23. 사립학교 교육비(교비) 분류=953,955,3
2-24. FY '99, 2001 사립전문대학ㆍ대학교ㆍ각종 학교(대학) 자금운용 예산 및 결산 현황=956,958,2
사회교육=958,960,1
3-1. 산업체부설고등학교현황=958,960,2
3-2. 근로청소년을위한특별학급현황=960,962,2
3-3. 고등학교입학자격검정고시실시상황(2000년도)=962,964,1
3-4. 고등학교졸업학력검정고시실시상황(2000년도)=962,964,2
3-5. 독학학위 취득시험 현황=964,966,1
3-6. 전국도서관(실)현황=965,967,1
3-7. 학력인정사회교육시설학교현황=966,968,2
학교보건=968,970,1
4-1. 학생표본 신체(체격) 검사 현황(2000년도)=968,970,1
4-2. 시ㆍ도별 학생표본 신체(키)검사 현황(2000년도)=969,971,1
4-3. 시ㆍ도별 학생표본 신체(몸무게)검사 현황(2000년도)=970,972,1
4-4. 체력검사현황(2000년도)=971,973,1
교육인적자원부기구표=972,974,2
만든사람들=974,976,1
판권지=975,977,1
영문목차
[title page etc.]=0,1,3
PREFACE=2,4,5
REMARKS=7,9,4
CONTENTS=11,13,10
I. BASIC STATISTICS ON SCHOOLS=21,23,2
1. Summary by School Level=23,25,1
1-1. General Status of Schools=24,26,2
1-2. Schools=26,28,2
1-3. Students=28,30,2
1-4. School Facilities=30,32,2
1-5. Teachers & Faculty Members=32,34,1
1-6. Clerical Staffs=33,35,1
1-7. Classes & Departments=34,36,1
2. Kindergarten=35,37,1
2-1. Summary=36,38,2
2-2. Kindergartens by Foundation=38,40,1
2-3. Kindergartens by Enrolled Children=38,40,1
2-4. Children by Age Groups=39,41,1
2-5. Teachers by Status=40,42,2
2-6. Teachers by Certification=42,44,2
2-7. Teachers by Teaching Experiences=44,46,2
2-8. Teachers by the Number of Years of Formal Education=46,48,2
2-9. Teachers by the Number of Years Passed after Certification=48,50,2
2-10. Teachers by Inservice Training=50,52,2
2-11. Teachers by Age Groups=52,54,2
2-12. Teachers by Pay Grades=54,56,4
2-13. Teachers by Housing Index=58,60,2
2-14. Annual Turnover of Teachers=60,62,2
2-15. School Site=62,64,2
2-16. Areas by Usage=64,66,1
2-17. Buildings by Constructing Materials=65,67,1
2-18. Areas of Buildings by Constructing Materials=66,68,2
2-19. Quantity of Energy Usage=68,70,1
2-20. Cooling & Heating Areas=69,71,1
2-21. Clerical Staffs=70,72,1
3. Elementary School=71,73,1
3-1. Summary=72,74,2
3-2. Schools by the Number of Classes=74,76,2
3-3. Schools by the Number of Pupils=76,78,1
3-4. Classes by Formation of Grades=76,78,2
3-5. Public Elementary Schools in Remote Places & Islands=78,80,4
3-6. Classes by the Number of Pupils=82,84,1
3-7. Classes in a Double-Shift System=82,84,1
3-8. Annual Turnover of Pupils=83,85,1
3-9. Pupils & Classes by Grades=84,86,2
3-10. Pupils by Grades & Age Groups=86,88,4
3-11. Graduates Who Continued to Higher Schooling=90,92,2
3-12. Teachers by Status=92,94,2
3-13. Teachers by Certification=94,96,2
3-14. Teachers by Teaching Experiences=96,98,2
3-15. Teachers by the Number of Years of Formal Education=98,100,2
3-16. Teachers by the Number of Years Passed after Certification=100,102,2
3-17. Teachers by Inservice Training=102,104,2
3-18. Teachers by Age Groups=104,106,2
3-19. Teachers by Pay Grades=106,108,4
3-20. Teachers by Housing Index=110,112,2
3-21. Annual Turnover of Teachers=112,114,2
3-22. Teachers by Educational Backgrounds=114,116,1
3-23. Enrollment of Children of the Right Age for Compulsory Education=115,117,1
3-24. School Site=116,118,2
3-25. Areas by Usage=118,120,1
3-26. Buildings by Constructing Materials=119,121,1
3-27. Areas of Buildings by Constructing Materials=120,122,2
3-28. Quantity of Energy Usage=122,124,1
3-29. Cooling & Heating Areas=123,125,1
3-30. The Number of Schools with Multiple Grade Classes & Single Classes=124,126,1
3-31. Educational Computers=125,127,1
3-32. Clerical Staffs=126,128,1
4. MIDDLE SCHOOL=127,129,1
4-1. Summary=128,130,5
4-2. Physical Education Middle Schools=133,135,1
4-3. Schools by the Number of Classes=134,136,2
4-4. Schools by the Number of Students=136,138,1
4-5. Classes by the Number of Students=137,139,1
4-6. Public Middle Schools in Remote Places & Islands=138,140,4
4-7. Students by Grades & Age Groups=142,144,2
4-8. Annual Turnover of Students=144,146,1
4-9. Admission of Freshmen=144,146,2
4-10. Graduates Who Continued to Higher Schooling=146,148,2
4-11. Students Supported by Scholarships & Tuition Fee Exemption=148,150,2
4-12. Funds for Scholarship Awarded & Tuition Fee Exempted=150,152,2
4-13. Establishment of Elective Courses=152,154,2
4-14. Teachers by Status=154,156,4
4-15. Teachers by Certification=158,160,2
4-16. Teachers by Teaching Experiences=160,162,2
4-17. Teachers by the Number of Years of Formal Education=162,164,2
4-18. Teachers by the Number of Years Passed after Certification=164,166,2
4-19. Teachers by Inservice Training=166,168,2
4-20. Teachers by Teaching Subjects=168,170,3
4-21. Teachers by Teaching Subjects=171,173,3
4-22. Teachers by Age Groups=174,176,2
4-23. Teachers by Teaching Hours Per Week=176,178,2
4-24. Teachers by Pay Grades=178,180,4
4-25. Teachers by Housing Index=182,184,2
4-26. Annual Turnover of Teachers=184,186,2
4-27. Teachers by Educational Backgrounds & Certified Subjects=186,188,3
4-28. Retired Teachers by Certified Subjects=189,191,3
4-29. School Site=192,194,2
4-30. Areas by Usage=194,196,1
4-31. Buildings by Constructing Materials=195,197,1
4-32. Areas of Buildings by Constructing Materials=196,198,2
4-33. Quantity of Energy Usage=198,200,1
4-34. Cooling & Heating Areas=199,201,1
4-35. Educational Computers=200,202,1
5. HIGH SCHOOL=201,203,1
5-1. Summary=202,204,4
5-2. Schools by the Number of Classes=206,208,2
5-3. Public High Schools in Remote Places & Islands=208,210,4
5-4. Schools by the Number of Students=212,214,1
6. GENERAL HIGH SCHOOL=213,215,1
6-1. Summary=214,216,4
6-2. Arts High Schools=218,220,4
6-3. Physical Education High Schools=222,224,4
6-4. Science High Schools=226,228,4
6-5. Foreign Language High Schools=230,232,4
6-6. Schools by the Number of Classes=234,236,2
6-7. Schools by the Number of Students=236,238,1
6-8. Classes by the Number of Students=237,239,1
6-9. Students by Grades & Age Groups=238,240,2
6-10. Annual Turnover of Students=240,242,2
6-11. Admission of Freshmen=242,244,2
6-12. Graduates Who Continued to Higher Schooling=244,246,2
6-13. Graduates by Employment & Advancement=246,248,4
6-14. Students Supported by Scholarship & Tuition Fee Exemption=250,252,2
6-15. Funds for Scholarship Awarded & Tuition Fee Exempted=252,254,2
6-16. Academic Courses of Comprehensive High Schools=254,256,3
6-17. General Curriculum in Three Majors=257,259,3
6-18. Curriculum in the Second Foreign Languages=260,262,2
6-19. Technical Curriculum in Industrial Arts & Home Economics=262,264,2
6-20. Establishment of Elective Liberal Art Courses=264,266,2
6-21. Teachers by Status=266,268,4
6-22. Teachers by Certification=270,272,2
6-23. Teachers by Teaching Experiences=272,274,2
6-24. Teachers by the Number of Years of Formal Education=274,276,2
6-25. Teachers by the Number of Years Passed after Certification=276,278,2
6-26. Teachers by Inservice Training=278,280,2
6-27. Teachers by Teaching Subjects=280,282,3
6-28. Teachers by Teaching Subjects=283,285,3
6-29. Teachers by Age Groups=286,288,2
6-30. Teachers by Teaching Hours per Week=288,290,2
6-31. Teachers by Pay Grades=290,292,4
6-32. Teachers by Housing Index=294,296,2
6-33. Annual Turnover of Teachers=296,298,2
6-34. Teachers by Educational Backgrounds & Certified Subjects=298,300,3
6-35. Retired Teachers by Certified Subjects=301,303,3
6-36. School Site=304,306,2
6-37. Areas by Usage=306,308,1
6-38. Buildings by Constructing Materials=307,309,1
6-39. Areas of Buildings by Constructing Materials=308,310,2
6-40. Quantity of Energy Usage=310,312,1
6-41. Cooling & Heating Areas=311,313,1
6-42. Educational Computers=312,314,1
7. VOCATIONAL HIGH SCHOOL=313,315,1
7-1. Summary=314,316,4
7-2. Agricultural High Schools=318,320,4
7-3. Technical High Schools=322,324,4
7-4. Commercial High Schools=326,328,4
7-5. Fishery & Marine High Schools=330,332,4
7-6. Vocational High Schools=334,336,4
7-7. Comprehensive High Schools=338,340,4
7-8. Schools by the Number of Classes=342,344,2
7-9. Schools by the Number of Students=344,346,1
7-10. Classes by the Number of Students=345,347,1
7-11. Students by Grades & Age Groups=346,348,2
7-12. Students by Courses=348,350,44
7-13. Annual Turnover of Students=392,394,2
7-14. Students Supported by Scholarship & Tuition Fee Exemption=3094,396,2
7-15. Funds for Scholarship Awarded & Tuition Fee Exempted=396,398,2
7-16. Graduates Who Continued to Higher Schooling=398,400,2
7-17. Graduates by Employment & Advancement=400,402,30
7-18. Admission of Freshmen=430,432,2
7-19. Curriculum in the Second Foreign Languages=432,434,2
7-20. Teachers by Status=434,436,4
7-21. Teachers by Certification=438,440,2
7-22. Teachers by Teaching Experiences=440,442,2
7-23. Teachers by the Number of Years of Formal Education=442,444,2
7-24. Teachers by the Number of Years Passed after Certification=444,446,2
7-25. Teachers by Inservice Training=446,448,2
7-26. Teachers by Teaching Subjects=448,450,7
7-27. Teachers by Teaching Subjects=455,457,7
7-28. Teachers by Age Groups=462,464,2
7-29. Teachers by Teaching Hours per Week=464,466,2
7-30. Teachers by Pay Grades=466,468,4
7-31. Teachers by Housing Index=470,472,2
7-32. Annual Turnover of Teachers=472,474,2
7-33. Teachers by Educational Backgrounds & Certified Subjects=474,476,7
7-34. Retired Teachers by Certified Subjects=481,483,7
7-35. School Site=488,490,2
7-36. Areas by Usage=490,492,1
7-37. Buildings by Constructing Materials=491,493,1
7-38. Areas of Buildings by Constructing Materials=492,494,2
7-39. Quantity of Energy Usage=494,496,1
7-40. Cooling & Heating Areas=495,497,1
7-41. Educational Computers=496,498,1
8. SPECIAL SCHOOL=497,499,1
8-1. Summary=498,500,2
8-2. Schools by Handicap=500,502,1
8-3. Students by Age Groups=500,502,2
8-4. Classes & Students by Grades=502,504,1
8-5. Graduates by Employment & Advancement(High School Course)=502,504,2
8-6. Students by Handicap=504,506,1
8-7. Clerical Staffs=505,507,1
8-8. Teachers by Status=506,508,2
8-9. Teachers by Certification=508,510,2
8-10. Teachers by Teaching Experiences=510,512,2
8-11. Teachers by the Number of Years of Formal Education=512,514,2
8-12. Teachers by Age Groups=514,516,2
8-13. Teachers by Housing Index=516,518,2
8-14. Annual Turnover of Teachers=518,520,2
8-15. Teachers by Pay Grades=520,522,4
8-16. School Site=524,526,2
8-17. Areas by Usage=526,528,1
8-18. Buildings by Constructing Materials=527,529,1
8-19. Areas of Buildings by Constructing Materials=528,530,2
8-20. Quantity of Energy Usage=530,532,1
8-21. Cooling & Heating Areas=531,533,1
8-22. School Equipment=532,534,1
9. OTHER SCHOOLS=533,535,1
9-1. Summary of Civic School=534,536,4
9-2. Summary of Civic High School=538,540,4
9-3. Summary of Trade High School=542,544,4
9-4. Summary of Miscellaneous School(Middle School Course)=546,548,4
9-5. Summary of Miscellaneous School(High School Course)=550,552,4
9-6. Students by Age Groups=554,556,8
9-7. Students by Courses=562,564,4
9-8. Annual Turnover of Students=566,568,1
9-9. Qualifying Examinations for Admission to Advanced Schools=567,569,1
9-10. Graduates Who Continued to Higher Schooling=567,569,1
9-11. Graduates by Employment & Advancement=568,570,6
9-12. Teachers by Certification=574,576,2
9-13. Teachers by Pay Grades=576,578,4
9-14. Teachers by Housing Index=580,582,2
9-15. School Site=582,584,2
9-16. Areas by Usage=584,586,1
9-17. Buildings by Constructing Materials=585,587,1
9-18. Areas of Buildings by Constructing Materials=586,588,2
9-19. Quantity of Energy Usage=588,590,1
9-20. Cooling & Heating Areas=589,591,1
9-21. Clerical Staffs=590,592,1
10. AIR & CORRESPONDENCE HIGH SCHOOL=591,593,1
10-1. Air & Correspondence High School Operation=592,594,1
11. INSTITUTIONS OF HIGHER EDUCATION=593,595,1
11-1. Summary=594,596,12
11-2. Foreign Students=606,608,2
11-3. Students Supported by Scholarship & Tuition Fee Exemption=608,610,2
11-4. Graduates by Employment & Advancement=610,612,15
11-5. Graduates Who Continued to Higher Schooling by Institutions=625,627,1
11-6. Faculty Members by Status=626,628,2
11-7. Faculty Members by Degree Awarded=628,630,2
11-8. Faculty Members by Major Fields=630,632,2
11-9. Faculty Members by Age Groups=632,634,2
11-10. Faculty Members by Teaching Experiences=634,636,2
11-11. Faculty Members by Lecturing Hours per Week=636,638,2
11-12. Faculty Members by Pay Grades=638,640,2
11-13. Annual Turnover of Faculty Members=640,642,2
11-14. Clerical Staffs=642,644,4
11-15. Foreign Faculty Members by Nationality=646,648,1
11-16. Areas of Buildings by Constructing Material=647,649,5
11-17. Areas by Usage=652,654,2
11-18. School Site=654,656,6
11-19. Libraries=660,662,1
12. JUNIOR COLLEGE=661,663,1
12-1. Summary=662,664,4
12-2. Students by Departments=666,668,34
12-3. Students by Age Groups=700,702,2
12-4. Admission of Freshmen(Applicatns, Entrants)=702,704,2
12-5. Annual Turnover of Students=704,706,1
13. UNIVERSITY OF EDUCATION=705,707,1
13-1. Summary=706,708,1
13-2. Students by Age Groups=706,708,2
13-3. Admission of Freshmen=708,710,1
13-4. Annual Turnover of Students=708,710,1
14. UNIVERSITY=709,711,1
14-1. Summary=710,712,4
14-2. Students by Departments=714,716,66
14-3. Students by Age Groups=780,782,2
14-4. Admission of Freshmen(Applicants, Entrants)=782,784,2
14-5. Annual Turnover of Students=784,786,1
15. GRADUATE SCHOOL=785,787,1
15-1. Summary=786,788,4
15-2. Graduate Schools=790,792,4
15-3. Graduate Schools(Professional)=794,796,9
15-4. Students by Age Groups=803,805,1
15-5. Students by Programs=804,806,58
15-6. Doctor's & Honorary Doctor's Degrees Granted=862,864,2
15-7. Annual Turnover of Students(Leaving School in Mid-program)=864,866,1
16. MISCELLANEOUS SCHOOL=865,867,1
16-1. Summary=866,868,4
16-2. Students by Departments=870,872,4
16-3. Students by Age Groups=874,876,2
16-4. Admission of Freshmen=876,878,2
16-5. Annual Turnover of Students=878,880,1
17. AIR & CORRESPONDENCE UNIVERSITY=879,881,1
17-1. Summary=880,882,1
17-2. Students by Age Groups=880,882,1
17-3. Students by Occupation=881,883,1
17-4. Students by Departments=882,884,2
18. INDUSTRIAL UNIVERSITY=884,886,1
18-1. Summary=885,887,1
18-2. Freshmen & Newly Enrolled Students by Age Groups=885,887,1
18-3. Freshmen & Newly Enrolled Students by Occupation=885,887,1
18-4. Students by Schools=886,888,2
19. TECHNICAL COLLEGE=888,890,1
19-1. Summary=888,890,1
19-2. Students by Age Groups=888,890,1
19-3. Students by Departments=888,890,2
20. EDUCATIONAL INSTITUTIONS FOR KOREAN RESIDENTS ABROAD=890,892,1
20-1. Korean Schools in Foreign Countries=891,893,1
20-2. Hangul Schools in Foreign Countries=892,894,1
20-3. Korean Educational Institutions in Japan=893,895,1
20-4. Korean Educational Institutions in America & Europe=893,895,1
20-5. Educational Officials in Foreign Countries=894,896,1
20-6. Teachers Dispatched to Foreign Countries=894,896,1
21. PRIVATE INSTITUTE=895,897,1
21-1. Summary=896,898,1
21-2. School Facilities=896,898,1
21-3. Attendants by Length of Course & Occupation=897,899,3
21-4. Attendants by Occupation & Educational Background=900,902,2
21-5. The Completed by Occupation & Educational Background=902,904,2
21-6. The Completed by Length of Course & Occupation=904,906,3
II. BASIC STATISTICS IN ADMINISTRATIVE WORK=907,909,2
1. Educational Administration=909,911,1
1-1. Table of Organization & Present Members on the List=909,911,3
1-2. Juridical Persons=912,914,1
1-3. Issue of Teacher's Certificates=913,915,1
1-4. Teacher's Inservice Training for Certificates=913,915,1
1-5. Inservice Training of Teachers=914,916,2
1-6. Textbook Publication=916,918,1
1-7. Distribution of Textbooks Free from Charges=916,918,1
1-8. Scholastic Ability Test=917,919,1
1-9. Ferry-Boats for School Supervision=917,919,1
1-10. Prizes Awarded from the National Academy of Science=917,919,1
1-11. Selection & Distribution of Government Scholarship Recipients=918,920,1
1-12. Foreign Grantees of Korean Government(MOE) Scholarship=918,920,1
1-13. School Meals Program=919,921,1
1-14. Audio-Visual Materials & Equipments of the District Media Libraries=920,922,2
2. Educational Finance=922,924,1
2-1. Government Budget vs. MOE Budget=922,924,1
2-2. Government Budget vs. MOE Budget by Years=923,925,1
2-3. MOE Revenue=924,926,1
2-4. MOE Expenditure=925,927,1
2-5. MOE Expenditure Classified by Items=926,928,2
2-6. Revenue & Settled Accounts of MOE=928,930,2
2-7. Expenditure & Settled Accounts of MOE=930,932,2
2-8. Details of Expenditure of MOE for the Emergency=932,934,1
2-9. Subsidies for Experimentation & Practical Training Fund=932,934,1
2-10. Educational Expenditure for National Schools=933,935,1
2-11. Educational Expenditure for Public Schools(Local Finance)=933,935,1
2-12. Revenue & Expenditure of Local Education Budget(Special Account)=934,936,3
2-13. Revenue & Expenditure of Settled Account for Local Education(Special Account)=937,939,3
2-14. Classified by Expenditure of Local Education Special Account=940,942,1
2-15. Sources for Local Education Finance by Year=941,943,1
2-16. Budget & Settled Accounts of School Juridical Person(Elementary and Secondary Education)=942,944,2
2-17. Budget & Settled Accounts of School Juridical Person(Institutions of Higher Education)=944,946,2
2-18. Budget of Revenue & Expenditure of School Support=946,948,2
2-19. Settled Accounts of Revenue & Expenditure of School Support=948,950,2
2-20. Academic Research Assistance Funds=950,952,1
2-21. National Properties=950,952,2
2-22. Revenues from Tuition Fees by School Level(For Each Person)=952,954,1
2-23. Details of Expenditure of Private Schools=953,955,3
2-24. Budget & Settled Accounts for Operation of Funds in Private Junior College, Universities & Miscellaneous Schools(Undergraduate Course)=956,958,2
3. Informal Education=958,960,1
3-1. High Schools Attached to Industrial Firms=958,960,2
3-2. Special Evening Classes for Working Youths=960,962,2
3-3. Results of the Qualifying Examination for High School Entrance=962,964,1
3-4. Results of the Qualifying Examination for High School Graduation=962,964,2
3-5. Bachelor's Degree Examination for the Self-Educated=964,966,1
3-6. Nation Wide Libraries=965,967,1
3-7. Accredited Nonformal Education Facilities and Schools=966,968,2
4. School Health Care=968,970,1
4-1. Students' Physical Development (Constitution)=968,970,1
4-2. Students' Physical Development (Stature) by Province=969,971,1
4-3. Students' Physical Development (Weight) by Province=970,972,1
4-4. The Examination of Physical Strength=971,973,1
5. Organization of the Ministry of Education & Human Resources Development=972,974,2
Contributors to the Publication=974,976,1
copyright=975,977,1
| 등록번호 | 청구기호 | 권별정보 | 자료실 | 이용여부 |
|---|---|---|---|---|
| 0000882536 | R 370.951 ㅁ317ㅁ | 2001 | 서울관 서고(열람신청 후 1층 대출대) | 이용가능 |
| 0000884624 | R 370.951 ㅁ317ㅁ | 2001 | 부산관 서고(열람신청 후 2층 주제자료실) | 이용가능 |
*표시는 필수 입력사항입니다.
| 전화번호 |
|---|
| 기사명 | 저자명 | 페이지 | 원문 | 기사목차 |
|---|
| 번호 | 발행일자 | 권호명 | 제본정보 | 자료실 | 원문 | 신청 페이지 |
|---|
도서위치안내: / 서가번호:

우편복사 목록담기를 완료하였습니다.
*표시는 필수 입력사항입니다.
저장 되었습니다.
