


권호기사보기
| 기사명 | 저자명 | 페이지 | 원문 | 기사목차 |
|---|
| 대표형(전거형, Authority) | 생물정보 | 이형(異形, Variant) | 소속 | 직위 | 직업 | 활동분야 | 주기 | 서지 | |
|---|---|---|---|---|---|---|---|---|---|
| 연구/단체명을 입력해주세요. | |||||||||
|
|
|
|
|
|
* 주제를 선택하시면 검색 상세로 이동합니다.
목차
[표제지 등]=0,1,2
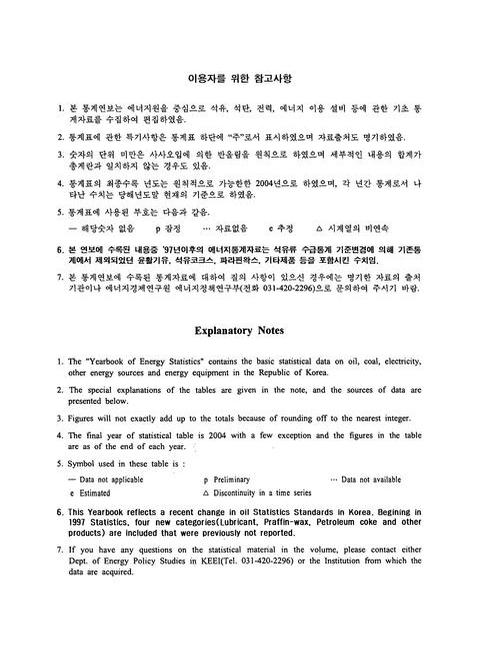
이용자를 위한 참고사항=0,3,1
에너지통계연보 작성자=0,4,1
목차=0,5,5
통계도표=1,10,8
I. 총에너지=9,18,3
1. 주요 에너지 지표=12,21,2
2. 1차에너지 소비=14,23,2
3. 1차에너지 소비(석유환산)=16,25,2
4. 1차에너지 공급 구조=18,27,2
5. 에너지 수출입 실적=20,29,2
6. 에너지 수입액=22,31,2
7. 최종 에너지 소비=24,33,2
8. 최종에너지 소비(석유환산)=26,35,2
9. 부문별 최종에너지 소비=28,37,2
10. 에너지 수급발란스(고유단위)=30,39,48
11. 에너지 수급발란스(석유환산)=78,87,49
II. 석유ㆍ가스류=127,136,3
1. 석유제품 수급추이=130,139,2
2. 석유제품 생산=132,141,2
3. 석유제품 국내소비=134,143,2
4. 석유제품 수출=136,145,2
5. 석유제품 수입=138,147,2
6. 시도별 석유제품 소비(2004)=140,149,4
7. 부문별 석유제품 소비=144,153,8
8. 산유국별 원유 도입=152,161,2
9. 원유 도입 단가=154,163,2
10. 원유 처리 현황=156,165,1
11. 정유시설 현황=157,166,1
12. 석유제품 소비자 가격=158,167,2
13. 도시가스 공급량 및 수요가수=160,169,2
14. 지역별 도시가스 보급 현황=162,171,2
15. 도시 가스 공급=164,173,1
16. 천연가스 수입=165,174,1
17. 천연가스 소비=165,174,1
18. 열 에너지 수급=166,175,1
III. 석탄류=167,176,3
1. 무연탄(분탄) 수급=170,179,2
2. 계절별 무연탄(분탄) 소비=172,181,2
3. 시도별 민수용 무연탄(분탄) 소비=174,183,2
4. 무연탄 수입=176,185,1
5. 연도별 저탄 현황=177,186,1
6. 무연괴탄 소비=177,186,1
7. 탄전별 무연탄 매장량=178,187,1
8. 국내 탄광 현황=179,188,1
9. 광업소별 무연탄 생산=180,189,2
10. 모광, 조광별 생산실적=182,191,1
11. 연도별 인원 및 생산성(O.M.S) 현황=183,192,1
12. 유연탄 수급=184,193,1
13. 유연탄 수입=185,194,1
14. 전국 연탄 공장 현황=186,195,1
15. 연탄가격=187,196,1
16. 탄광 재해 현황=188,197,2
17. 일반광 재해 현황=190,199,3
IV. 전력=193,202,3
1. 전력 종합=196,205,4
2. 발전 설비=200,209,2
3. 발전소별 설비=202,211,10
4. 송전 설비=212,221,2
5. 변전 설비=214,223,2
6. 배전 설비=216,225,2
7. 설비별 발전 전력량=218,227,2
8. 에너지 원별 발전 전력량=220,229,2
9. 발전 연료 소비량=222,231,4
10. 화력 발전소 열효율=226,235,2
11. 송배전 손실=228,237,2
12. 산업 분류별 전력 소비량=230,239,4
13. 종별 수용가 수 및 판매전력량=234,243,2
14. 행정 구역별 수용가 수=236,245,2
15. 행정 구역별 판매 전력량=238,247,2
16. 종별 판매단가 및 판매수입=240,249,2
17. 현행 전기요금표=242,251,5
18. 전기요금 개정 추이=247,256,8
V. 주요에너지 이용설비=255,264,3
1. 업종별 보일러 보유 현황=258,267,1
2. 용량별 보일러 보유 현황=258,267,2
3. 주요 가전기기 생산=260,269,2
4. 수송시설 및 설비=262,271,2
5. 자동차 등록 현황=264,273,4
6. 도로현황=268,277,2
7. 등록선박통계=270,279,4
8. 항공기보유현황=274,283,1
9. 태양열 이용 시설 보급 현황=275,284,2
VI. 주요광물자원=277,286,3
1. 광산물 생산=280,289,4
2. 광산물 내수=284,293,4
3. 광산물 수출=288,297,4
4. 광산물 수입=292,301,4
5. 광종별 국내 기준 가격=296,305,2
6. 자원매장량=298,307,2
7. 주요 광물의 국별 매장량=300,309,2
8. 총수출ㆍ입 중 광산물 비중=302,311,1
VII. 해외에너지통계=303,312,3
1. 1차에너지 원별 소비=306,315,2
2. 1차에너지 지역별 소비=308,317,2
3. 1차 에너지 원별 지역별 소비(2004/2003)=310,319,2
4. 지역별 석유 및 천연가스 확인 매장량=312,321,2
5. 지역별 석유 생산=314,323,8
6. 지역별 석유 소비=322,331,4
7. 국별 주요 석유제품 소비=326,335,2
8. 주요 산유국의 원유 수출 가격=328,337,1
9. 주요 원유 가격 추이=329,338,1
10. OECD 주요국의 석유 재고량=330,339,1
11. 주요 국별 석유제품 소매가=331,340,1
12. 지역별 천연가스 생산=332,341,2
13. 지역별 천연가스 소비=334,343,2
14. 지역별 석탄 매장량=336,345,2
15. 지역별 석탄 생산=338,347,2
16. 지역별 석탄 소비=340,349,2
17. 주요 국별 전력 수급(2002)=342,351,2
18. 주요 국별 전력 소비=344,353,4
19. 지역별 수력 소비=348,357,2
20. 지역별 원자력 소비=350,359,2
21. 국별 원자력발전 설비 현황=352,361,1
22. 각국의 전력 판매 단가=353,362,2
VIII. 주요경제통계=355,364,3
1. 주요 통계 지표=358,367,4
2. 경제활동별 국내 총생산=362,371,4
3. 상품류별 수출=366,375,2
4. 상품류별 수입=368,377,2
5. 수송실적=370,379,2
6. 전도시 소비자 물가지수=372,381,2
7. 생산자 물가지수=374,383,3
8. 특수 분류별 생산자 물가지수=377,386,1
9. 주요 에너지 제품별 생산자 물가지수=378,387,4
10. 중앙정부의 기능적 세출 예산(일반회계 )=382,391,5
부록ㆍ참고자료=387,396,2
1. 단위 환산표=389,398,5
2. 연료 및 열의 석유 환산 기준=394,403,3
3. IPCC 탄소 배출 계수=397,406,1
4. 에너지 일반개념=398,407,1
[판권지]=399,408,1
영문목차
[title page etc.]=0,1,2
Explanatory Notes=0,3,2
Contents=0,5,5
Statistics In Charts=1,10,8
I. Energy=9,18,3
1. Major Energy Indicators=12,21,2
2. Primary Energy Consumption=14,23,2
3. Primary Energy Consumption(Oil Equivalent)=16,25,2
4. Primary Energy Supply Structure=18,27,2
5. Energy Export And Import=20,29,2
6. Import Amount Of Energy=22,31,2
7. Final Energy Consumption=24,33,2
8. Final Energy Consumption(Oil Equivalent)=26,35,2
9. Final Energy Consumption By Demand Sector=28,37,2
10. Energy Balance(Original Units)=30,39,48
11. Energy Balance(Oil Equivalent)=78,87,49
II. Oil & Gas=127,136,3
1. Petroleum Products Demand & Supply=130,139,2
2. Production By Petroleum Products=132,141,2
3. Domestic Petroleum Products Consumption=134,143,2
4. Petroleum Products Exports=136,145,2
5. Petroleum Products Imports=138,147,2
6. Petroleum Products Consumption By Region(2004)=140,149,4
7. Petroleum Products Consumption By Sector=144,153,8
8. Crude Oil Imports From Country Of Origin=152,161,2
9. Crude Oil Price=154,163,2
10. Refinery Runs=156,165,1
11. Capacity Of Oil Refining Facilities=157,166,1
12. Consumer Price Of Petroleum Products=158,167,2
13. Number Of Town Gas Customers By Use=160,169,2
14. Number Of Town Gas Customers By Region=162,171,2
15. Town Gas Demand & Supply=164,173,1
16. LNG Imports=165,174,1
17. LNG Consumption=165,174,1
18. Heat Energy Demand & Supply=166,175,1
III. Coal=167,176,3
1. Anthracite Demand & Supply=170,179,2
2. Anthracite Consumption By Season=172,181,2
3. Anthracite Consumption In Residential And Commercial Sector By Region=174,183,2
4. Anthracite Imports=176,185,1
5. Anthracite Stock Piles=177,186,1
6. Lump Coal Consumption=177,186,1
7. Anthracite Reserves By Coal Field=178,187,1
8. Number Of Anthracite Mine=179,188,1
9. Anthracite Production By Mine=180,189,2
10. Production By Type Of Mining=182,191,1
11. Coal Mining Employees And Output Per Man Shift=183,192,1
12. Bituminous Demand And Supply=184,193,1
13. Bituminous Imports=185,194,1
14. Number Of Briquette Factory=186,195,1
15. Briquette Price=187,196,1
16. Coal Mining Accidents=188,197,2
17. Mining Accidents(Except Coal Mines)=190,199,3
IV. Electricity=193,202,3
1. Trend Of Consolidated Electric Power=196,205,4
2. Generating Facilities=200,209,2
3. Trend Of Generating Facilities By Plant=202,211,10
4. Transmission Facilities=212,221,2
5. Substation Facilities=214,223,2
6. Distribution Facilities=216,225,2
7. Electric Power Generation By Facility=218,227,2
8. Electric Power Generation By Energy Source=220,229,2
9. Fuel Consumption For Generation=222,231,4
10. Trend Of Thermal Plant Efficiency=226,235,2
11. Transmission And Distribution Losses=228,237,2
12. Electric Power Consumption By Industry=230,239,4
13. Electric Power Sold & Number Of Customers By Tariff=234,243,2
14. Number Of Customers By Region=236,245,2
15. Electric Power Sold By Region=238,247,2
16. Average Price Per KWh & Total Revenues By Tariff=240,249,2
17. Table For Current Electricity Tariff=242,251,5
18. Trend Of Revision In Electricity Tariff=247,256,8
V. Major Energy Facilities=255,264,3
1. Number Of Boilers By Sector=258,267,1
2. Number Of Boilers By Capacity=258,267,2
3. Production Of Major Electric Appliances=260,269,2
4. Transport Facilities And Equipment=262,271,2
5. Motor Vehicles Registration=264,273,4
6. Length Of Roads=268,277,2
7. Vessels Registered=270,279,4
8. Aircraft Holdings=274,283,1
9. Solar Energy Using Facilities=275,284,2
VI. Major Mineral Resources=277,286,3
1. Domestic Production Of Principal Mineral Products=280,289,4
2. Domestic Demand Of Mineral Products=284,293,4
3. Exports Of Mineral Products=288,297,4
4. Imports Of Mineral Products=292,301,4
5. Domestic Reference Price Of Ore=296,305,2
6. Reserves Of Resource=298,307,2
7. Primary Mineral Reserves By Country=300,309,2
8. Share Of Mining Products In Total ImportㆍExport=302,311,1
VII. World Energy Statistics=303,312,3
1. Primary Energy Consumption=306,315,2
2. Primary Energy Consumption By Region=308,317,2
3. Primary Energy Consumption By Region(2004/2003)=310,319,2
4. Proven Reserves Of Oil & Gas By Region=312,321,2
5. Oil Production By Region=314,323,8
6. Oil Consumption By Region=322,331,4
7. Petroleum Products Consumption By Country=326,335,2
8. Crude Oil Exports From Selected Country=328,337,1
9. Crude Oil Prices=329,338,1
10. Petroleum Stocks In OECD Countries=330,339,1
11. Retail Price Of Petroleum Product By Country=331,340,1
12. Natural Gas Production By Region=332,341,2
13. Natural Gas Consumption By Region=334,343,2
14. Coal Reserves By Region=336,345,2
15. Coal Production By Region=338,347,2
16. Coal Consumption By Region=340,349,2
17. Electric Power Demand & Supply By Country(2002)=342,351,2
18. Electric Power Consumption By Country=344,353,4
19. Hydro Energy Consumption By Region=348,357,2
20. Nuclear Energy Consumption By Region=350,359,2
21. Nuclear Generation Facilities By Country=352,361,1
22. Price Of Electric Power Sold By Country=353,362,2
VIII. Major Economic Statistics=355,364,3
1. Indicators Of Major Statistics=358,367,4
2. Gross Domestic Product By Kind Of Economics Activity=362,371,4
3. Export By Commodity Groups=366,375,2
4. Import By Commodity Groups=368,377,2
5. Transported=370,379,2
6. All Cities Consumer Price Indexes=372,381,2
7. Producer Price Indexes=374,383,3
8. Producer Price Indexes By Special Classification=377,386,1
9. Producer Price Indexes Of Major Energy Products=378,387,4
10. Functional Classification Of Central Goverment Expenditure(General Account)=382,391,5
Appendix And Reference=387,396,3
1. Unit Conversion Factors=390,399,4
2. Energy Conversion Factors/Oil Equivalent=394,403,3
3. Carbon Emission Factors=397,406,1
4. General Conception Of Energy=398,407,1
[copyright]=399,408,1
jpg
1. 경제성장과 에너지소비=2,11,1
2. 1차 에너지 공급=3,12,1
3. 에너지소비=4,13,1
4. 에너지 수입가격=5,14,2
5. 정유시설 현황=7,16,1
6. 발전설비 추이=7,16,1
| 등록번호 | 청구기호 | 권별정보 | 자료실 | 이용여부 |
|---|---|---|---|---|
| 0001106312 | R 338.0186058 ㅇ242ㅇ | 2005 | 서울관 서고(열람신청 후 정기간행물실(524호)) | 이용가능 |
| 0001106313 | R 338.0186058 ㅇ242ㅇ | 2005 | 부산관 서고(열람신청 후 2층 주제자료실) | 이용가능 |
*표시는 필수 입력사항입니다.
| 전화번호 |
|---|
| 기사명 | 저자명 | 페이지 | 원문 | 기사목차 |
|---|
| 번호 | 발행일자 | 권호명 | 제본정보 | 자료실 | 원문 | 신청 페이지 |
|---|
도서위치안내: / 서가번호:

우편복사 목록담기를 완료하였습니다.
*표시는 필수 입력사항입니다.
저장 되었습니다.
