


권호기사보기
| 기사명 | 저자명 | 페이지 | 원문 | 기사목차 |
|---|
| 대표형(전거형, Authority) | 생물정보 | 이형(異形, Variant) | 소속 | 직위 | 직업 | 활동분야 | 주기 | 서지 | |
|---|---|---|---|---|---|---|---|---|---|
| 연구/단체명을 입력해주세요. | |||||||||
|
|
|
|
|
|
* 주제를 선택하시면 검색 상세로 이동합니다.
표제지
제출문
보고서 초록
요약문
SUMMARY
목차
체중 및 당대사조절 생물지표를 활용한 다원적 기능성 평가시스템 연구 16
제출문 18
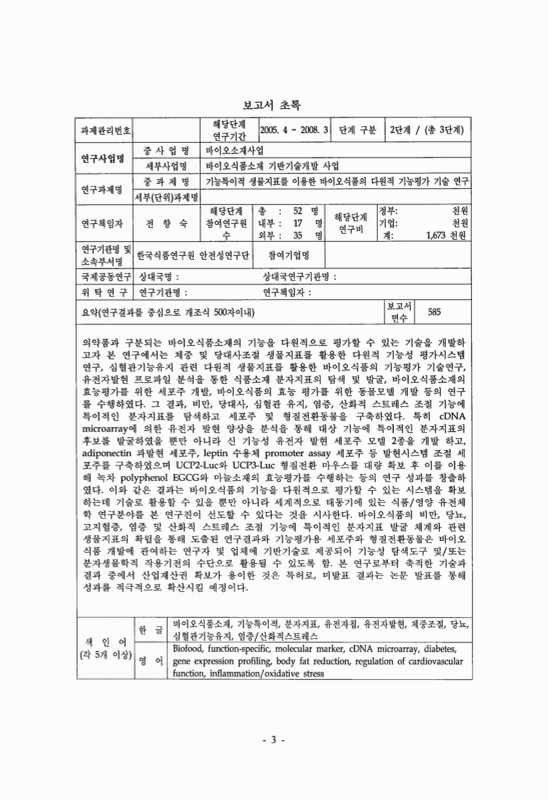
보고서 초록 20
요약문 22
SUMMARY 26
CONTENTS 28
목차 30
제1장. 연구개발과제의 개요 32
제2장. 국내외 기술개발 현황 37
제3장. 연구개발수행 내용 및 결과 45
제4장. 목표달성도 및 관련분야에의 기여도 127
제5장. 연구개발결과의 활용계획 134
제6장. 연구개발과정에서 수집한 해외과학기술정보 138
제7장. 참고문헌 140
심혈관기능유지 관련 다원적 생물지표를 활용한 바이오식품의 기능평가 기술연구에 관한 연구 144
제출문 146
보고서 초록 148
요약문 150
SUMMARY 152
CONTENTS 154
목차 156
제1장 연구개발과제의 개요 158
제2장 국내외 기술개발 현황 159
제3장 연구개발 수행 내용 및 결과 162
제4장 목표달성도 및 관련분야에의 기여도 207
제5장 연구개발결과의 활용계획 210
제6장 연구개발과정에서 수집한 해외과학기술정보 211
제7장 참고문헌 213
연구개발 결과 활용계획서 217
[첨부1] 연구개발 결과 및 활용계획서 218
자체평가의견서 222
바이오식품소재의 기능특이적 분자지표 발굴 및 응용연구 226
제출문 228
보고서 초록 230
요약문 232
SUMMARY 236
CONTENTS 240
목차 242
제1장 연구개발과제의 개요 244
제2장 국내외 기술개발 현황 246
제3장 연구개발수행 내용 및 결과 249
제4장 목표달성도 및 관련분야에의 기여도 407
제5장 연구개발결과의 활용계획 413
제6장 연구개발과정에서 수집한 해외과학기술정보 414
제7장 참고문헌 416
연구개발 결과 활용계획서 421
[첨부1] 연구개발 결과 및 활용계획서 422
자체평가의견서 426
바이오식품소재의 효능 평가를 위한 세포주 개발 432
제출문 434
보고서 초록 436
요약문 438
SUMMARY 442
CONTENTS 446
목차 448
제1장 연구개발과제의 개요 450
제1절 연구개발의 목적 450
제2절 연구개발의 필요성 450
제3절 연구개발의 범위 452
제2장 국내·외 기술개발 현황 454
제1절 국내·외 기술개발현황 454
제2절 연구결과가 국내·외 기술개발현황에서 차지하는 위치 456
제3장 연구개발수행 내용 및 결과 457
제1절 신 기능성 유전자 발현 세포주 모델 개발 457
제2절 발현시스템 조절 세포주 구축 465
제3절 다중 유전자 발현 세포주 개발을 위한 유전자 연구 470
위탁과제 연구결과 473
제4절 단백질체 기술 확립 473
제5절 신기능성 바이오마커의 탐색 476
제6절 Leptin 수용체 결여 세포주와 과다 발현 세포주의 효능비교 488
제7절 새로이 개발된 신기능성 biomarker 발현 세포주의 효능 검증 489
제4장 목표달성도 및 관련분야에의 기여도 493
제5장 연구개발결과의 활용계획 497
제6장 연구개발과정에서 수집한 해외과학기술정보 498
제7장 참고문헌 499
연구개발 결과 활용계획서 502
[첨부1] 연구개발 및 활용계획서 503
자체평가의견서 508
바이오식품의 효능 평가를 위한 동물모델 개발 514
제출문 516
보고서 초록 518
요약문 520
SUMMARY 522
CONTENTS(영문목차) 524
목차 526
제1장 연구개발과제의 개요 528
제2장 국내외 기술개발 현황 530
제3장 연구개발수행 내용 및 결과 531
제4장 목표달성도 및 관련분야에의 기여도 571
제5장 연구개발결과의 활용계획 574
제6장 연구개발과정에서 수집한 해외과학기술정보 575
제7장 참고문헌 576
연구개발 결과 활용계획서 578
[첨부1] 연구개발 결과 및 활용계획서 579
자체평가의견서 583
체중 및 당대사조절 생물지표를 활용한 다원적 기능성 평가시스템 연구 16
FIGURE 1. Body weight gain of rats fed experimental diets for 9 weeks... 60
FIGURE 2. Viseral fat pads weight of rats fed ND or HFD for 9 weeks.... 61
FIGURE 3. Increased visceral fat cell size in rats fed the high fat diet (HFD) compared to those fed the normal diet(ND).... 62
FIGURE 4. Histological profiles of liver tissues from rats fed the normal diet (ND) or the high fat diet (HFD) for 9 weeks(wks). Images captured at 200x magnification. 64
FIGURE 5. Hepatic lipogenic enzyme activities of rats fed ND or HFD for 9 weeks... 65
FIGURE 6. Serum fasting glucose concentrations of rats fed ND or HFD... 66
FIGURE 7. Serum glucose, insulin, c-peptide, and leptin levels, and insulin resistance index of rats fed the normal diet (ND) or the high fat diet (HFD) for 9 wk.... 67
FIGURE 8. Western blot analysis of adiponectin receptor 2 in liver of rats fed experimental diets for 9 weeks... 68
FIGURE 9. Quality check results images of ND and HFD group... 69
FIGURE 10. Quality check results images of ND and HFD group.... 69
FIGURE 11. Array images showing different levels of epididymal fat gene expression of normal diet and high fat diet treated rats. 70
FIGURE 12. Array images showing different levels of hepatic gene expression of normal diet and high fat diet treated rats. 70
FIGURE 13. MA-plots represent genes activated and repressed by high fat diet in the epididymal fat tissue of diet-induced obesity rat.... 71
FIGURE 14. MA-plots represent genes activated and repressed by high fat diet in the liver of diet-induced obesity rat.... 71
FIGURE 15. Flow chart of total account of hepatic tissue and epididymal adipose tissue genes analyzed by cDNA microarray analysis 72
FIGURE 16. Expression of energy expenditure-related genes quantified by quantitative real time RT-PCR.... 80
FIGURE 17. Expression of lipid metabolism-related genes quantified by quantitative real time RT-PCR.... 80
FIGURE 18. Expression of adipocyte differentiation-related genes quantified by quantitative real time RT-PCR.... 81
FIGURE 19. Expression of insulin resistance-related genes quantified by quantitative real time RT-PCR.... 81
FIGURE 20. Expression of β-oxidation-related genes quantified by quantitative real time RT-PCR.... 82
FIGURE 21. Body weight gain of mice fed experimental diets for 12 weeks... 95
FIGURE 22. Visceral fat pads weight of mice fed experimental diets for 12 weeks... 96
FIGURE 23. Histological images of epididymal adipose tissue in mice fed experimental diets for 12 weeks.... 97
FIGURE 24. Serum insulin, leptin and adiponectin levels of mice fed the normal diet group(ND), the high fat diet group(HFD) or the high diet + Garcinia canbogia extract group(HFD+G) for 12 weeks... 98
FIGURE 25. Histological profiles of liver tissues from mice fed experiment diet for 12 weeks... 99
FIGURE 26. Quality check of RNA samples prepared from the epididymal adipose tissue of mice... 99
FIGURE 27. An oligoDNA microarray image (A) and MA-plots (B) of the mouse epididymal adipose tissue genes regulated by the high-fat diet 100
FIGURE 28. Flow chart of total account of epididymal adipose tissue genes regulated by the high-fat diet as analyzed by oligoDNA microarray analysis 100
FIGURE 29. Classification by the biological function of genes with altered expression(≥2 fold) by the high-fat diet in the epididymal adipose tissue of mice:... 101
FIGURE 30. Model for major signaling pathways involved in the translocation of the GLUT4 from the cytosol to the plasma membrane in the adipose tissue.... 105
FIGURE 31. Western blot analysis of the whole-tissue extract of epididymal adipose tissue... 106
FIGURE 32. Western blot analysis of the plasma-tissue extract of epididymal adipose tissue... 107
FIGURE 33. Body weight of mice fed experimental diets... 117
FIGURE 34. Western blot analysis of epididymal adipose tissue for Toll-like receptor/NFkB signaling pathway.... 119
FIGURE 35. Western blot analysis of epididymal adipose tissue for adipogenesis.... 121
FIGURE 36. Body weight gain or rats fed experimental diets... 122
FIGURE 37. Gene expressions determined by quantitative RT-PCR analyses in the epididymal fat tissues from rats fed experimental diets.... 125
FIGURE 38. Protein levels of phosphorylated AMPK and ACC determined by Western blot.... 126
FIGURE 39/38. Toll-like receptors such as TLR4 are important for mediating out innate immune response to bacterial pathogenes and also triggers inflammatory processes upon exposure to certain dietary fats (Tschop M, Thomas G., Nature medicine, 12: 1359-1361, 2006). 135
FIGURE 40/39. TLR4 mediated FFA-induced activation of inflammatin and metabolic signalling in insulin resistance (kim, Cell metabol, 4: 417-419, 2006). 135
심혈관기능유지 관련 다원적 생물지표를 활용한 바이오식품의 기능평가 기술연구에 관한 연구 144
Fig. 1-1. Effect of resveratrol and fibrate on serum total cholesterol and triglyceride concentration of hamsters fed with high-fat, high-cholesterol diet.... 163
Fig. 1-2. Effect of resveratrol on serum Apo B and serum Lp(a) concentration of hamsters fed with high fat diet 164
Fig. 1-3. Representative ORO staining of liver tissue on experimental hamsters. 166
Fig. 1-4. Effect of quercetins on serum total cholesterol and triglyceride concentration of hamsters fed with high fat diet.... 167
Fig. 1-5. Effect of quercetins on serum free cholesterol concentration and atherogenic index (AI) of hamsters fed with high fat diet. 167
Fig. 1-6. Effect of Quercetins on serum Apo B and Lp(a) concentration of hamsters fed with high fat diet. 169
Fig. 1-7. Effect of quercetins on hepatic total lipid and cholesterol contents of hamsters fed with high fat diet. 170
Fig. 1-8. Effect of quercetins on hepatic triglyceride contents of hamsters fed with high fat diet. 170
Fig. 1-9. Representative ORO staining of liver tissue on experimental hamsters. 171
Fig. 1-10. Changes of body weights of the experimental animals for 8weeks. 172
Fig. 1-11. Effect of quercetin and resveratrol on serum lipids concentration and atherogenic index of mouse fed with high fat diet.... 173
Fig. 1-12. Effect of quercetin and resveratrol on Apo A-I and Apo B concentration of mouse fed with high fat diet. 174
Fig. 1-13. Effect of resveratrol on total antioxidant status and TBARS of hamsters fed with high fat diet. 174
Fig. 1-14. Effect of quercetin and resveratrol on activities of GOT and GPT in mouse fed with high fat diet. 175
Fig. 1-15. Representative ORO staining of liver tissue on experimental mouse 176
Fig. 1-16. Representative HE staining of epididymal fat on experimental mouse 176
Fig. 1-17. Gene expression change by high fat control group compared with normal diet group 177
Fig. 1-18. Gene expression change by quercetin group and resveratrol group compared with high fat control group 178
Fig. 1-19. Ontology profile changes of gene expression by high fat control group compared with normal diet group 178
Fig. 1-20. Ontology profile changes of gene expression by quercetin diet compared with high fat control group 179
Fig. 1-21. Ontology profile changes of gene expression by resveratrol diet compared with high fat control group 179
Fig. 1-22. mRNA expression by real-time PCR in the liver of mouse fed with experimental diet. 183
Fig. 1-23. Lipid metabolism related gene protein expression 184
Fig. 1-24. Dietary quercetin and resveratrol alter lipid metabolism in liver of mouse fed with high fat diet. 184
Fig. 2-1. Morphology of aortic sinus from Apo E-/-(이미지참조) mice given clofibrate(CF) and resveratrol(RV).... 188
Fig. 2-2. Effects of resveratrol supplementation on mRNA expression of PPARα and SREBP-1c in Apo E -/-(이미지참조) mice.... 192
Fig. 2-3. Effects of tannin supplementation on mRNA expression of HMGR and PAP in Apo E-/-(이미지참조) mice.... 192
Fig. 2-4. Hepatic protein expression in Apo E -/-(이미지참조) mice fed normal diets supplemented resveratrol.... 193
Fig. 2-5. Cryosection of aortic sinus from Apo E-/-(이미지참조) mice given clofibrate (CF) and tannin (T).... 195
Fig. 2-6. Effects of tannin supplementation on hepatic antioxidative enzyme activities in Apo E -/-(이미지참조) mice.... 196
Fig. 2-7. Effects of tannin supplementation of mRNA expression of HMGR, ACAT, ACC and PAP in Apo E -/-(이미지참조) mice.... 198
Fig. 2-8. Hepatic protein expression in Apo E -/-(이미지참조) mice fed normal diets supplemented tannin.... 199
Fig. 2-9. Effect of resveratrol on aortic surface plaque by Sudan red IV staining... 201
Fig. 2-10. Representative H&E stained sections from aortic arch of experimental rabbits of each group.... 201
Fig. 2-11. Representative ORO staining of aorta tissue on experimental rabbit.... 202
Fig. 2-12. Representative western blot analysis of aorta tissue on experimental rabbit.... 203
Fig. 2-13. mRNA expression of ICAM-1, VCAM-1, p-Selection and MCP-1 in artery of experimental rabbits.... 204
바이오식품소재의 기능특이적 분자지표 발굴 및 응용연구 226
Fig 1. Microarray work-flow. 255
Fig 2. Total RNA extraction procedure. 256
Fig 3. Example of RNA quality check. 257
Fig 4. Image analysis. 257
Fig 5. Data normalization using scatter plot method. 258
Fig 6. Example of hierachical clustering plot. 258
Fig 7. Example of biological cassification using DAVID. 259
Fig 8. Principle ad procedure of real-time RT PCR. 261
Fig 9. Histological sections of colonic mucosa stained with hematoxylin and eosin.... 270
Fig 10. Hierarchical cluster plot image.... 272
Fig 11. Microarray process flowchart. 273
Fig 12. Gene ontology classification in DSS-induced mice colon. 274
Fig 13. Comparison of gene expression between microarray and real-time PCR.... 280
Fig 14. Protein expressions affected by DSS exposure in mice.... 281
Fig 15. The variations of body weight and colon length in DSS-induced colitis model.... 283
Fig 16. MPO activity and presence of diarrhea and bloody stool.... 284
Fig 17. Histological sections of colonic mucosa stained with hematoxylin and eosin.... 285
Fig 18. Edema and inflammation score in colonic tissue.... 286
Fig 19. Scatter matrix plots represent the correlation of microarray samples.... 288
Fig 20. Hierarchical clustering images for normalized signal values.... 289
Fig 21. Schematic diagram of microarray. 290
Fig 22. Gene ontology classification in DSS-induced mice colon. 291
Fig 23. K-means clustering pattern analysis.... 293
Fig 24. Inflammatory gene expression assayed by western blot. 301
Fig 25. IL-6 mRNA and protein expression.... 302
Fig 26. The variations of body weight and colon length in DSS-induced colitis model.... 304
Fig 27. MPO activity and presence of diarrhea and bloody stool.... 305
Fig 28. Histological sections of colonic mucosa stained with hematoxylin and eosin.... 306
Fig 29. Histological score in colonic tissue.... 307
Fig 30. Gene ontology classification in DSS-induced mice colon. 309
Fig 31. K-means clustering pattern analysis.... 310
Fig 32. The variations of body weight and colon length in DSS-induced colitis model.... 318
Fig 33. MPO activity and presence of diarrhea and bloody stool.... 319
Fig 34. Histological sections of colonic mucosa stained with hematoxylin and eosin.... 320
Fig 35. Histological score in colonic tissue.... 321
Fig 36. Hierarchical clustering. 323
Fig 37. K-menas clustering pattern analysis. 324
Fig 38. The variations of body weight and colon length in DSS-induced colitis model.... 331
Fig 39. MPO activity and presence of diarrhea and bloody stool.... 332
Fig 40. Histolofical sections of colonic mucosa stained with hematoxylin and eosin.... 333
Fig 41. Histological score in colonic tissue.... 334
Fig 42. Hierarchical clustering. 336
Fig 43. K-means clustering pattern analysis. 337
Fig 44. Effect of water extracts from PJ on GOT and GPT activities in rats exposed to ethanol induced hepatic injury in rats. 345
Fig 45. Effect of water extracts from PJ on antioxidant enzyme activities and MDA levels wxposed to ethanol in rats. 347
Fig 46. Effect of water extracts from PJ on TG levels exposed to ethanol in rats. 348
Fig 47. Diagrammatic representation of the genes tested in acute ethanol-induced exposed to acute ethanol. 351
Fig 48. Classified differentially expressed genes induced by acute ethanol treatment in rat. 352
Fig 49. Effect of water extracts from PJ on GOT and GPT activities exposed to chronic ethanol administration in rats. 358
Fig 50. Effect of water extracts from PJ on antioxidant enzyme activities, GSH, MDA levels against chronic ethanol administration in rats. 359
Fig 51. Effect of water extracts from PJ on Cholesterol and TG levels against chronic ethanol administration injury in rats. 361
Fig 52. Effect of water extracts from PJ on ethanol metabolic enzyme activities exposed to chronic ethanol administ in rats. 363
Fig 53. Diagrammatic representation of the genes tested in chronic ethanol-induced hepatic injury in rat 365
Fig 54. Differentially expressed genes induced by chronic ethanol treatment in rat. 366
Fig 55. Effect of pycnogenol on GOT, GPT, ALP and LDH activities against ethanol-induced oxidative stress rat model 376
Fig 56. Effect of pycnogenol on Catalase, MDA, GSH and GPx against chronic ethanol-induced hepatic injury in rats. 378
Fig 57. Effect of pinexol on alcohol metabolizing enzymes against ethanol-induced hepatic injury in rats. 380
Fig 58/55. Hierarchical cluster plot 382
Fig 59/56. Diagrammatic representation of the genes tested in ethanol-induced oxidative stress rat model 383
Fig 60/57. Differentially expressed gene number. 384
Fig 61. cDNA microarray analysis of anti-inflammatory effects of caryophyllene using TNF-α-treated HT-29 human colon cells. 388
Fig 62. Clustering : Identification of 9 groups affected by TNF-α and caryophyllene 389
Fig 63. Validation of gene expression by semi-quantitative RT-PCR 392
Fig 64. Validation of gene expression by Western bolt 392
Fig 65. Validation of gene expression by Western and Northern blot 393
Fig 66. Identification of 15 gene groups affected by TNF-α and lipoic acid(A) and TNF-α and silymarin(B) 394
Fig 67. Comparison of anti-inflammatory effect of lipoic acid and silymarin using TNF-α-activated colonic inflammation signaling 395
Fig 68. Effect of Sacchromyces boulardii(SBS) on the TNF-α inflammation signal pathway in HT-29 397
Fig 69. Effect of Sacchromyces boulardii (SBS) on the histologic features of TNBS-induced colitis (A) and the expression of proinflammatory mediaters in colon tissue (B) 397
Fig 70. α-lipoic acid suppresses human colon cancer cell growth by inducing apoptosis and G₁ arrest of the cell cycle 398
Fig 71. Suppression of mRNA expression of RPS6K4(ribosomal protein p90S6K, a novel inhibitor of p53 by α-lipoic acid (ALA) (semi-quantitative RT-PCR) 399
Fig 72. Enhancement of p53 protein stability by α-lipoic acid... 399
Fig 73. α-lipoic acid enhances tumor cell reponse to apoptic stresses 400
Fig 74. Activation of RPS6K4 mRNA expression through NF-kB signaling and ALA inhibition of NF-kB in human colon cancer cells 401
Fig 75. Apoptosis-sensitizing effect of α-lipoic acid is highly dependent on p53 activation via RPS6K4 downstream 401
Fig 76. Schematic representation of p53-activating function of α-lipoic acid through RPS6K4 suppression via NF-kB inhibition 402
바이오식품소재의 효능 평가를 위한 세포주 개발 432
Fig. 1. The cell death (a) and DNA fragmentation (b) by Naphthalene treatment.... 458
Fig. 2. (a) Quantitative real time PCR result after treated 293T cells with Naphthalene for 24h. Reduced COXIII expression by naphthalene treatment (b) The PCR product of COXIII gene. (c) The vector of pCMV-Tag 2 (d)The COXIII gene is introduced into pCMV-Tag 2 vector. 458
Fig. 3. (a) Quantitative real time PCR result after treated 293T cells with Naphthalene for 24h. Reduced Cullin1 expression by naphthalene treatment (b) The PCR product of Culin1 gene. (c) The vector of pLNCX 2 (d) The Cullin1 gene is introduced into pLNCX 2 vector. 458
Fig. 4. The cell line that constitutively overexpresses Cullin1. 459
Fig. 5. The mechanism of RNA interference(RNAi) and sippression of Leptin receptor expression.... 460
Fig. 6. The change of RhoC and Osteopontin in osteoclastogenesis for 6days(a), the clonong of RhoC and Osteopontin genes(b). 462
Fig. 7. The overexpression of RhoC in stable HEK293 cell lines.... 462
Fig. 8. The RT- PCR for candidates.... 464
Fig. 9. The cloning of GSTPi and HNRPH1 genes in pCMV-Tag 2B vector. 464
Fig. 10. Transfection and overexpression of HNRPH1 and GSTPi in 293T cells.... 464
Fig. 11. Nucleotide sequence of adiponectin gene (a) and PCR product from genomic DNA in mature 3T3-L1(b). 465
Fig. 12. The cell lines that constitutively over-expresses adiponectin proteins(a) and the expression of adiponcetin mRNA by natural compounds in adiponcetiin overexpressed cell line(b). 466
Fig. 13. pGL3-Basic vector circle map(a), DNA sequence(b) and PCR product(c) believed to be promoter position. 467
Fig. 14. Comparison of luciferase activites expressed in HEK 293 transfected with pGL3-Basic and pGL3-leptin receptor promoter plasmids. 467
Fig. 15. Luciferase activities expressed in HEK 293 transfected with 14 clones which have fragments by serial deletion. 468
Fig. 16. Luciferase activities expressed in HEK 293 transfected with PPRE. 469
Fig. 17. GeneFishing™ DEG screening result after induction by leptin in HEK293-OB-Rb. 470
Fig. 18. The immunoprecipitated proteins by RhoC-Ab in RAW 264.7 cell(a). The idintified proteins by Maldi-TOF(b). 472
Fig. 19. The immunoprecipitated proteins by RhoC-Ab and then immunoblotting bt β-actin and RhoC antibody in RAW 264.7 cell. 472
Fig. 20. The mRNA expression of Synaptotagmin 13(a) and β-Actin(b) during osteoclast differentiation.... 472
Fig. 1. 2D Gel Elextrophoresis result of 293T cells treated with Aroclor 1254 for 12h. 473
Fig. 2. The RT- PCR for candidates.... 474
Fig. 3. The PCR product of GST1 gene. 474
Fig. 4. The protein level of GSTpi and p-JNK by western blotting after treatment with Aroclor 1254. 475
Fig. 5. The identification of GSTpi activity by western blotting after treatment with Aroclor1254. 475
Fig. 6. The overview of Gene Fishing™ DEG (Differentially Expressed Gene) Assay. 475
Fig. 7. GeneFishing™ DEG screening result after TRANCE/M-CSF induced osteoclast formation in murine RAW 264.7 cell.... 476
Fig. 8. The rate of the mRNA expression of RhoC in RAW 264.7 cells after differentiation during 6 days by Real-Time PCR.... 477
Fig. 9. vector map과 PCR을 수행하여 얻은 PPAR-γ product 478
Fig. 10. Doenjang's water solube fraction suppresses M-CSF/ TRANCE-induced osteoclast formation in primary bone marrow macrophage cells.... 479
Fig. 11. The mRNA expression of osteoclast differentiation markers.... 479
Fig. 12. Effect of the Doenjang's water soluble fraction (1 mg/ml) on the proliferation of MC3T3-E1 cells.... 480
Fig. 13. Alkine phosphatase staining of MC3T3-E1 cells.... 481
Fig. 14. The alkaline phosphatase activity of the MC3Ts-E1 cells.... 481
Fig. 15. Von Kossa staining of MC3T3-E1 cells.... 481
Fig. 16. The results of differentially expressed gene screening.... 482
Fig. 17. The changed creld2 gene expression of the Doenjang treatment in MC3Ts-E1 cells during 6 day differentiation.... 483
Fig. 18. The GeneFishing™ DEG screening results after treated 293T cells with the naphthalene for 24h. The 16 spots were identified. 484
Fig. 19. The changed genes expression by the naphthalene exposure for 24h by RT- PCR for candidates:... 485
Fig. 20. Quantitative real time PCR.... 485
Fig. 21. The characterization of cell death by western blotting.... 486
Fig. 22. The characterization of cell cycle by western blotting.... 486
Fig. 23. Transfection and overexpression of Cullin1 and HNRPH1 in 293T cells.... 487
Fig. 24. RT-PCR of OB-Rb overexpressing stable cell line. 488
Fig. 25. Realtime-PCR of OB-Rb overexpressing stable cell line. 488
Fig. 26. Suppression of Leptin receptor expression in 3T3-L1:... 489
Fig. 27. The overexpression of Leptin receptor in 3T3-L1 and HEK293 cells.... 489
Fig. 28. The selection of osteoclastogenesis-positive and negative effect materials by TRAP staining assay. 490
Fig. 29. Osteoclastogenesis의 (a)촉진효능이 있는 것과 (b)억제효능이 있는 천연물질을 Rho C stable-HEK 293 cell 처리한 후 western blot 수행. 490
Fig. 30. Osteoclastogenesis의 (a)촉진효능이 있는 것과 (b)억제효능이 있는 천연물질을 Rho C stable-HEK 293 cell 처리한 후 RT-PCR 수행. 491
Fig. 31. Cullin 과발현 세포주에 naphthalene을 처리하여 western blot 방법으로 세포주로서의 유효성확인. 492
바이오식품의 효능 평가를 위한 동물모델 개발 514
Fig. 1. Construction (A) and agarose gel electrophoresis (B) of the UCP2 1.8kb(-1800/+30)/pGL3-basic plasmid.... 536
Fig. 2. Effects of EGCG on the mRNA level of UCP2 in 3T3-L1 cells (A) and HepG2 cells(B).... 537
Fig. 3. Effect of EFCG diets on the UCP2 mRNA expression in epidydimal adipose tissue (A) and liver (B) of rats fed high-fat diets.... 537
Fig. 4. Effects of EGCG on the UCP3(-1800/+30bp) promoter activity in 3T3L1 cells (A) and HepG2 cells(B).... 538
Fig. 5. Establishment of optimal condition for detecting of transgene expression.... 539
Fig. 6. PCR results of F0 transgenic mice 540
Fig. 1. Results of PCR amplification of genomic DNA isolated from F1 transgenic mice tail 546
Fig. 2. Results of PCR amplification of genomic DNA isolated from F2 transgenic mice tail 547
Fig. 3. Results of PCR amplification of genomic DNA isolated from F3 transgenic mice tail 547
Fig. 4. Body weight gain during high fat diet-feeding in UCP2 transgenic mice.... 548
Fig. 5. Effect of EGCG on the body weight gain in UCP2 transgenic mice.... 549
Fig. 6. Effect of EGCG on the epudydimal adipose tissue weight (g/100g of body weight).... 549
Fig. 7. Luciferase activity in the epidydimal adipose tissue UCP2-Luc transgenic mice.... 550
Fig. 8. Construction (A) and agarose gel electrophoresis (B) of the UC3 1.8kb/pGL3-basic 4.8kb plasmid.... 551
Fig. 9. Effects of EPA on the mRNA level of UCP3 in C2C12 cells.... 552
Fig. 10. Effect of garlic on the UC3 mRNA expression in dpididymal adipose tissue of mice fed highfat diets.... 552
Fig. 11. Effects of EPA on the UC3(-1790/+52 bp) promoter activity in C2C12 cells.... 553
Fig. 1. Results of PCR amplification of genomic DNA isolated from F4 transgenic mice tail 558
Fig. 2. Results of PCR amplification of genomic DNA isolated from F5 transgenic mice tail 559
Fig. 3. Results of PCR amplification of genomic DNA isolated from F6 transgenic mice tail 560
Fig. 4. Body weight gain (A) and energy intake (B) in UCP2-Luc transgenic mice fed experimental diets.... 561
Fig. 5. Plasma triflyceride (A), total cholesterol (B) and leptin (C) in UCP2-Luc transgenic mice fed experimental diets.... 562
Fig. 6. Luciferase activity in various tissues of UCP2-Luc transgenic mice fed experimental diets.... 563
Fig. 7. Body weight gain (A) and energy intake (B) in UCP2-Luc transgenic mice fed experimental diets.... 564
Fig. 8. Plasma triglyceride (A), total cholesterol (B) and leptin (C) in UCP2-Luc transgenic mice fed experimental diets.... 565
Fig. 9. Luciferase activity in various tissues of UCP2-Luc transgenic mice fed experimental diets.... 565
Fig. 10. PCR results of F0 transgenic mice 568
Fig. 11. Results of PCR amplification of genomic DNA isolated from F1 transgenic mice tail 569
Fig. 12. Results of PCR amplification of genomic DNA isolated from F2 transgenic mice tail 570
*표시는 필수 입력사항입니다.
| 전화번호 |
|---|
| 기사명 | 저자명 | 페이지 | 원문 | 기사목차 |
|---|
| 번호 | 발행일자 | 권호명 | 제본정보 | 자료실 | 원문 | 신청 페이지 |
|---|
도서위치안내: / 서가번호:

우편복사 목록담기를 완료하였습니다.
*표시는 필수 입력사항입니다.
저장 되었습니다.
