권호기사보기
| 기사명 | 저자명 | 페이지 | 원문 | 기사목차 |
|---|
| 대표형(전거형, Authority) | 생물정보 | 이형(異形, Variant) | 소속 | 직위 | 직업 | 활동분야 | 주기 | 서지 | |
|---|---|---|---|---|---|---|---|---|---|
| 연구/단체명을 입력해주세요. | |||||||||
|
|
|
|
|
|
* 주제를 선택하시면 검색 상세로 이동합니다.
표제지
제출문
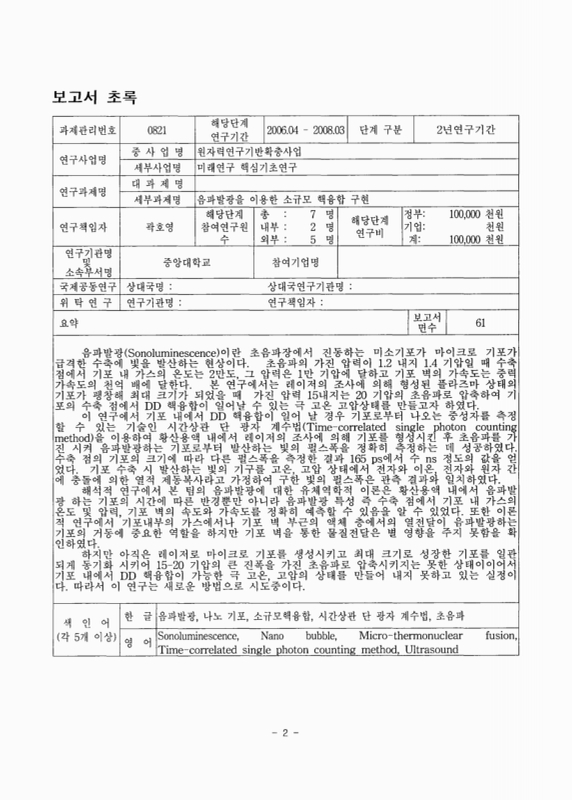
보고서 초록
요약문
SUMMARY
CONTENTS
목차
제1장 연구개발과제의 개요 및 필요성 10
1절 과제개요 10
2절 연구개발의 필요성 10
제2장 국내외 기술개발 현황 11
제3장 연구개발 수행 내용 및 결과 15
3.1. 음파발광하는 기포의 거동에 대한 유체역학적 이론 15
3.1.1. 구형 기포내 가스에 대한 Navier-Stokes 방정식의 해석해 15
3.1.2. 초음파장에서 진동하는 기포의 거동 21
3.1.3. 열경계층에서의 온도분포 22
3.1.4. 황산용액에서의 음파발광 현상 24
3.1.5. 황산 용액에서의 기포 거동 25
3.1.6. 황산 용액에서의 기포벽에서의 물질 전달 39
3.2 음파발광하는 기포로부터 방출하는 빛의 펄스측정 42
3.2.1. SL의 펄스 폭 측정 42
3.2.2/3.2.3. 관련이론 43
3.2.3. 실험 결과 44
3.2.4. 결론 46
3.3 중성자 측정 장치 구축 54
제4장 목표달성도 및 연구 성과 57
제5장 연구개발결과의 활용방안 59
제6장 연구개발과정에서 수집한 해외과학기술정보 60
제7장 참고문헌 61
[Figure 1] 평형반경 0.7 ㎛의 기포가 수축 시 기포내부의 온도분포. 12
[Figure 2] 기포 내 106(이미지참조) K에 달하는 온도에 의한 SL 평형 반경 0.7 ㎛ 기포의 스펙트럼 강도 계산과 실험결과.... 12
[Figure 3] 황산용액 내에서 평형반경 15 ㎛가 가진압력이 1.5기압 주파수가 37.8kHz인 초음파장에서 거동할 경우 기포반경의 시간적 변화.... 13
Figure 4. A physical model with thermal boundary layer for a spherical bubble in liquid 23
Figure 5. Theoretical radius-time curve along with observed one by Hopkins et al.[8] for xenon bubble of R0=15.0 ㎛ at PA=1.50 atm fd=37.8 kHz in sulfuric acid solutions.(이미지참조) 28
Figure 6. Calculated bubble wall velocity (line) and acceleration (dash) near the collapse point for the bubble shown in Fig. 5. (a) is a case of SL and (b) is a case of non-SL. 29
Figure 7. Calculated radius-time curve obtained by using polytropic relation with polytropic index, n=1.3. 30
Figure 8. Calculated bubble wall velocity and acceleration near the collapse point for the bubble shown in Fig. 7. 31
Figure 9. Time dependent gas temperature at the bubble center and the corresponding total blackbody emission with the average temperature for the gas inside the bubble shown in Fig. 5. 32
Figure 10. Temperature and pressure distribution at the collapse point shown in Fig. 5 The dotted curve indicates the case with the temperature distribution given in Eq. (27). 33
Figure 11/13. Calculated radius-time curves with different temperature distributions for the bubble shown in Fig. 2. 36
Figure 12. Calculated bubble center temperatures for the cases shown in Fig. 2 and 4 37
Figure 13. Calculated gas pressure depending on time for an argon bubble of R0=13.0㎛ at PA=1.40 atm and fd=28.5 kHz.(이미지참조) 38
Figure 14. Experimental setup for time-correlated single-photon counting (TC/SPC) and light scattering 45
Figure 15. Response to a 300 fs, 400 nm laser pulse for the TC/SPC (a) and measured pulse width (b) for an air bubble of R0 = 5.5 ㎛ in water with an ultrasound frequency of 28.76 kHz and amplitude of 1.24 atm.(이미지참조) 48
Figure 16. Measured bubble radius-time curves and pulse widths of xenon bubble of R0(이미지참조) = 12 ㎛ in sulfuric acid solutions with an ultrasound frequency of 27.4 kHz and an amplitude of 1.35 atm (a), FWHM (b). 49
Figure 17. Measured bubble radius-time curves and pulse widths of xenon bubble of R0(이미지참조) = 12 ㎛ in(㎛in) sulfuric acid solutions with an ultrasound frequency of 34.2 kHz and an amplitude of 1.40 atm (a), FWHM (b). 50
Figure 18. Measured bubble radius-time curves and pulse widths of air bubble of R0(이미지참조) = 7 ㎛ in(㎛in) D₂O with an ultrasound frequency of 27.23kHz and an amplitude of 1.40 atm (a) and FWHM (b) 51
Figure 19. Measured bubble radius-time curves and pulse widths of air bubble of R0(이미지참조) = 12 ㎛ in concentration(21%) of glycerin with water under an ultrasound frequency of 24.83kHz and an amplitude of 1.36 atm (a), FWHM (b). 52
Figure 20. Measured bubble radius-time curves and pulse widths of air bubble of R0(이미지참조) = 13 ㎛ in concentration(42%) of glycerin with water under an ultrasound frequency of 25.79 kHz and an amplitude of 1.38 atm (a), FWHM (b) 53
Figure 21-a. Schematic diagram of test apparatus for nuclear fusion in side a laser-induced bubble. 55
Figure 21-b. Scheme for detection of neutrons from nano size bubble. 56
*표시는 필수 입력사항입니다.
| 전화번호 |
|---|
| 기사명 | 저자명 | 페이지 | 원문 | 기사목차 |
|---|
| 번호 | 발행일자 | 권호명 | 제본정보 | 자료실 | 원문 | 신청 페이지 |
|---|
도서위치안내: / 서가번호:

우편복사 목록담기를 완료하였습니다.
*표시는 필수 입력사항입니다.
저장 되었습니다.
