


권호기사보기
| 기사명 | 저자명 | 페이지 | 원문 | 기사목차 |
|---|
| 대표형(전거형, Authority) | 생물정보 | 이형(異形, Variant) | 소속 | 직위 | 직업 | 활동분야 | 주기 | 서지 | |
|---|---|---|---|---|---|---|---|---|---|
| 연구/단체명을 입력해주세요. | |||||||||
|
|
|
|
|
|
* 주제를 선택하시면 검색 상세로 이동합니다.
표제지
목차
제출문 2
보고서 초록 3
요약문 4
SUMMARY 11
CONTENTS 13
I. 나노구조 내식코팅 기술 개발 14
제1장 연구개발과제의 개요 14
제1절 나노구조 초경코팅 기술 14
제2절 나노구조 고상윤활코팅 기술 14
제2장 국내외 기술개발 현황 16
제1절 국외의 기술개발 현황 16
제2절 국내의 기술개발 현황 17
제3장 연구개발수행 내용 및 결과 19
제1절 연구개발 수행방법 19
제2절 연구개발 수행 내용 및 결과 29
1. 나노구조 초경 용사코팅 기술 29
2. 나노구조 고상윤활 용사코팅 기술 63
제4장 목표달성도 및 관련분야에의 기여도 96
1. 차년도별 연구개발 목표 및 내용 97
2. 세부연구목표 및 평가의 착안점 98
3. 연구범위 및 연구수행 방법 99
4. 연구목표의 달성도 102
제5장 연구개발결과의 활용계획 104
1. 연구개발결과의 활용 계획 105
2. 사업화 계획의 적절성 105
제6장 연구개발과정에서 수집한 해외과학기술정보 105
제7장 참고문헌 106
II. 나노구조 내식코팅 기술 개발 109
목차 109
제1장 연구개발과제의 개요 112
제1-1절 연구개발 목적 112
제1-2절 연구개발 필요성 112
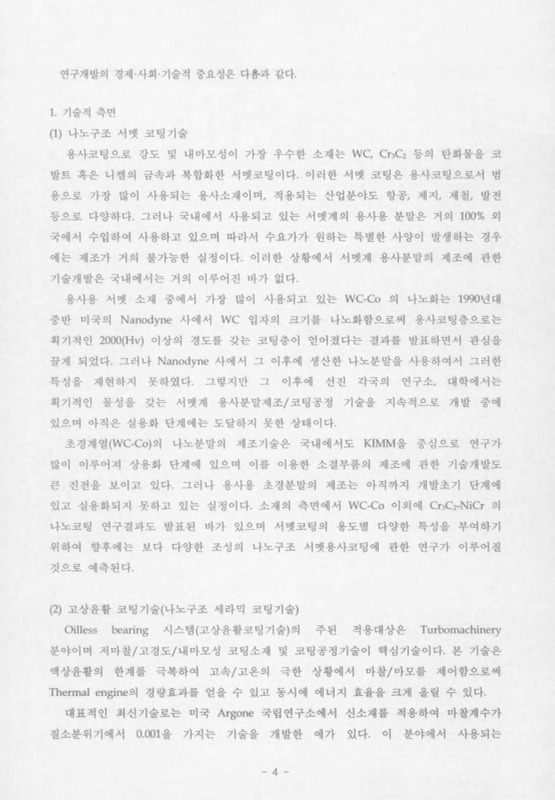
1-2-1. 기술적 측면 112
1-2-2. 사회 경제적 측면 115
제3절 연구개발 목표 및 범위 116
1-3-1. 연구 목표 116
1-3-2. 연구 범위 118
제2장 국내외 기술개발 현황 119
제2-1절 국내외 연구개발 현황 및 실적 119
제2-2절 국내·외 기술개발현황에서 차지하는 위치/기여도 120
제3장 연구개발수행 내용 및 결과 122
제3-1절 나노구조 용사 코팅용 소재 제조 및 특성 평가 122
3-1-1. 분무 건조 제조공정에 의한 분말 제조 122
가. Spray Drying 공정상 변수에 따른 실험방법의 변화 123
나. Slurry 제조상 변수에 따른 실험방법의 변화 123
3-1-2. 분무건조 과립분말의 특성 124
3-1-3. Spray Dryer 공정 변수에 따른 분말 Granule의 특성 125
가. Atomizer Disk 회전속도의 영향 125
나. Slurry Feeding Rate의 영향 129
다. Atomizer Disk 크기의 영향 129
라. Chamber Pressure의 영향 131
3-1-4. Slurry 제조 변수에 의한 과립분말의 특성 133
가. Slurry의 결합제의 영향 133
나. Slurry 고상율의 영향 135
제3-2절 나노구조 용사 코팅 공정 최적화 138
3-2-1. 플라즈마 용사 코팅의 비행 액적 열적 거동 해석 139
가. 세라믹 용사 분말의 열적 거동 해석 141
나. 액적의 적층 단계 수치 해석 144
3-2-2. Y₂O₃의 용사 코팅 시 조업인자의 영향에 대한 고찰 146
가. 서론 146
나. 실험 방법 147
다. Formulations 148
라. 실험결과 149
마. Discussion 155
바. Summary 163
제3-3절 나노코팅재의 최적 코팅 조건 163
3-3-1 나노구조 코팅 구현 원리 163
3-3-2 나노구조 코팅을 위한 장비 개조 및 조업 조건 설정 169
제3-4절 나노구조 코팅층의 미세조직 및 특성 평가 172
3-4-1. 서론 172
3-4-2. 실험방법 173
가. 과립분말 173
나. 플라즈마 스프레이에 의한 코팅층 제조 175
다. 미세조직 관찰 및 특성평가 176
라. ICP 플라즈마 식각 저항성 평가 176
3-4-3. Y₂O₃ 코팅층의 미세조직 및 특성 평가 177
가. 원료분말공급시스템에 따른 코팅층의 미세조직 및 특성 177
나. 플라즈마 스프레이 출력에 따른 코팅의 미세조직 및 특성 181
다. 플라즈마 식각 거동 185
3-4-4. Al₂O₃-Y₂O₃(이미지참조)계 나노복합재료 코팅층의 특성 189
가. Al₂O₃-Y₂O₃(이미지참조)계 복합재료 코팅의 미세조직 및 특성 189
나. Al₂O₃-Y₂O₃(이미지참조)계 복합재료 코팅의 열처리 영향 194
다. 플라즈마 식각 거동 199
3-4-5. 결론 204
제3-5절 나노구조 코팅재의 현장 기술 개발 및 실용화 연구 205
3-5-1. 반도체/LCD 장비용 나노구조 내식 코팅 시제품 제조 205
가. 반도체/LCD 제조 공정 및 코팅 소재 205
나. 나노/비정질 내식 코팅 현장 적용 기술 및 부품 개발 212
제4장 목표달성도 및 관련분야에의 기여도 215
제4-1절 연구목표의 달성도 215
제4-2절 국제 기술수준과 나노사업단 연구에 의한 기술발전에의 기여도 218
제4-3절 정량적 연구 성과 222
제4-4절 연구개발 인프라구축 성과 222
4-4-1. 참여연구원(인원수) 222
4-4-2. 인력양성 성과 223
제5장 연구개발결과의 활용계획 223
제5-1절 연구개발결과의 활용 및 향후 계획 223
제6장 연구개발과정에서 수집한 해외과학기술정보 224
제7장 참고문헌 224
Fig. 3-1-1-1. Schematic diagram of spray dryer system 20
Fig. 3-1-1-2. Schematic diagram of various disk types 21
Fig. 3-1-1-3. Atomization theory and schematic diagram of pressure nozzle 22
Fig. 3-1-1-4. Schematic diagram of two Fluid nozzle 22
Fig. 3-1-2-1. Experimental schematic of the in-flight particle diagnostics 23
Fig. 3-1-2-2. Schematic diagram of various nozzle types 24
Fig. 3-1-2-3. Relationship between flame velocity and combustion chamber pressure 24
Fig. 3-1-2-4. Flame temperature changes according to fuel flow rate and oxygen flow rate 25
Fig. 3-1-2-5. Optimization of spray condition ;... 26
Fig. 3-1-3-1. Characteristics of θ-gun 27
Fig. 3-1-3-2. Slurry Feeding Unit System 28
Fig. 3-2-1-1-1. Preparation of first nanostructured WC-Co powder by spray dryer 30
Fig. 3-2-1-1-2. SEM images of nanostructured WC-Co powder 30
Fig. 3-2-1-2-1. Preparation of second nanostructured WC-Co powder by spray dryer 32
Fig. 3-2-1-2-2. SEM images of second nanostructured WC-Co powder 32
Fig. 3-2-1-2-3. Particle distribution and XRD pattern of second nanostructured WC-Co powder 33
Fig. 3-2-1-2-4. Schematic diagram of HVOF JP-5000 33
Fig. 3-2-1-2-5. Pressure changes in a combustion chamber according to the changes of fuel and oxygen rate 34
Fig. 3-2-1-2-6. Cross-sectional distributions of the particle temperatures at a distance of 380 mm and fuel rate of 5.1 gph according to the changes of oxygen rates(scfh) 37
Fig. 3-2-1-2-7. Cross-sectional distributions of tile particle temperatures at a distance of 380 mm and fuel rate of 6.0 gph according to the changes of oxygen rates(scfh) 39
Fig. 3-2-1-2-8. Cross-sectional distributions of the particle velocities(m/sec.) at a distance of 380 mm and fuel rate of 5.1 gph according to the changes of oxygen rates(scfh) 41
Fig. 3-2-1-2-9. Cross-sectional distributions of the particle velocities(m/sec.) at a distance of 380 mm and fuel rate of 6.0 gph according to the changes of oxygen rates(scfh) 43
Fig. 3-2-1-2-10. Changes of particles' velocities and temperatures at a stand-off distance 380 mm. They were measured at the center of the flames with variation of oxygen rates and fixed fuel rate 5.1 gph 44
Fig. 3-2-1-2-11. Changes of particles' velocities and temperatures at a stand-off distance 380 mm. They were measured at the center of the flames with variation of oxygen rates and fixed fuel rate 6.0 gph 44
Fig. 3-2-1-2-12. Relationship between the particle velocity and combustion pressure at a stand-off distance 380 mm. They were measured at the center of the flames with variation of oxygen rates and fifed fuel rate 5.1 and 6.0 gph 45
Fig. 3-2-1-2-13. SEM images of second nanostructured WC-Co coating 46
Fig. 3-2-1-2-14. XRD patterns of second nanostructured WC-Co powder and coating 46
Fig. 3-2-1-2-15. Comparison of wear results by scratch wear test 50
Fig. 3-2-1-3-1. Preparation of third nanostructured WC-Co powder by spray dryer 51
Fig. 3-2-1-3-2. Particle distribution and SEM Images of third nanostructured WC-Co powder 52
Fig. 3-2-1-3-3. SEM images of prepared WC-Co powder in inframat corporation 52
Fig. 3-2-1-3-4. Comparison of flow ability as a various WC-Co powders 53
Fig. 3-2-1-3-5. SEM images of third nanostructured WC-Co coating 54
Fig. 3-2-1-3-6. SEM images of commercialized WC-Co coating 54
Fig. 3-2-1-3-7. Comparison of wear results by scratch wear test 55
Fig. 3-2-1-4-1. Particle distribution and SEM images of fourth nanostructured WC-Co powder 56
Fig. 3-2-1-4-2. Comparison of flow ability as a various WC-Co powders 56
Fig. 3-2-1-4-3. Comparison of wear results by scratch wear test 57
Fig. 3-2-1-5-1. Preparation of fifth nanostructured WC-Co powder by spray dryer 58
Fig. 3-2-1-6-1. Application of mechanical seal 59
Fig. 3-2-1-6-2. Application result of mechanical seal 60
Fig. 3-2-1-6-3. Application of cylinder rod 60
Fig. 3-2-1-7-1. Schematic diagram of nanostructured slurry coating system 61
Fig. 3-2-1-7-2. SEM images of nanostructured WC-Co slurry feeder coatings 61
Fig. 3-2-1-7-3. SEM images and EDS analysis of nanostructured solid lubricant slurry feeder coatings 62
Fig. 3-2-2-1-1-1. SEM Surface Morphology of initial feedstock for spray drying. 64
Fig. 3-2-2-1-1-2. Spray dried feedstock with added nano-sized Cr₂O₃ 65
Fig. 3-2-2-1-1-3. Element distribution and phase fraction after spray dried powder feedstock. 66
Fig. 3-2-2-1-2-1. Characteristics of a bulk amorphous feedstock. 67
Fig. 3-2-2-1-2-2. Constituent particle morphology. 69
Fig. 3-2-2-2-2-1. SEM micrograph (BSE) of PS304 and spray dried coating;... 71
Fig. 3-2-2-2-2-2. SEM micrograph (BSE) of BMG and BMG-Cr₂O₃ and BMG-Cr₂O₃-Ag-BaF₂/ CaF₂ coating.(이미지참조) 72
Fig. 3-2-2-2-2-3. XRD results of the powedr feedstock and coatings. 73
Fig. 3-2-2-2-3-1. Variation of chemical composition with the increase of H₂ flow rate (NiCr-Cr₂O₃-Ag-BaF₂/CaF₂).(이미지참조) 75
Fig. 3-2-2-2-4-1. Comparison of the coating thickness and porosity of (A) PS304 and (B) spray dried and (C) BMG-Cr₂O₃-Ag-BaF₂/CaF₂. 76
Fig. 3-2-2-2-5-1. Comparison of microhardness of coatings with the increase of H₂flow rate. 77
Fig. 3-2-2-2-6-1. Bond strength test. 79
Fig. 3-2-2-2-6-2. Comparison of bond strength of coatings with the increase of H₂ flow rate. 79
Fig. 3-2-2-3-1. Friction coefficient and weight loss according to service temperature. 81
Fig. 3-2-2-3-2. Comparison of wear surface and wear cross-section at room temperature. 82
Fig. 3-2-2-4-1-1. (a) Rig test tribotester and (b) friction current at start-up, lift, shut-down, and stationary state during one cycle at RT and 350℃ (c) schematic drawing of Foil bearing. 83
Fig. 3-2-2-4-1-2. Journal and air foil bearing before rig rest 84
Fig. 3-2-2-4-1-3. Journal after rig rest 85
Fig. 3-2-2-4-1-4. Friction current of the NiCr base PS304 and spray dried coatings during rig test cycling at RT and 350℃. 86
Fig. 3-2-2-4-1-5. Friction current of the BMG-Cr₂O₃ and BMG-Cr₂O₃-Ag-BaF₂/CaF₂ coatings during rig test cycling at RT and 350℃.(이미지참조) 86
Fig. 3-2-2-4-1-6. Journals an foils after rig test at RT and 350℃ 87
Fig. 3-2-2-4-2-1. (a) Worn surface and mapping of Ag and (b) phase fraction [wt%] on Ni base PS304 coating; (c) worn surface and mapping of Ag and (d) phase fraction [wt%] on spray dried coating. 89
Fig. 3-2-2-4-2-2. SEM morphologies of transferred tribofilm and mapping of Ag on the counterpart surface from tile (a) blended coating and (b) nanostructured composite coating along with the (c) transferred Ag tribofilm content. 89
Fig. 3-2-2-4-2-3. EPMA mapping for worn surface of the journal at RT and 350 ℃ 90
Fig. 3-2-2-4-3-1. SEM micrograph (BSE) and XRD peaks of the BMG-Cr₂O₃ coating(이미지참조) 92
Fig. 3-2-2-4-3-2. DSC curves and amorphous phase fraction of BMG-Cr₂O₃ coating.(이미지참조) 92
Fig. 3-2-2-4-3-3. SEM micrograph (BSE) and XRD peaks of theBMG-Cr₂O₃-Ag-BaF₂/CaF₂ coating.(이미지참조) 93
Fig. 3-2-2-4-3-3. SEM morphologies of the BMC-Cr₂O₃ coating(이미지참조). 95
Fig. 3-2-2-4-3-4. SEM morphologies of the BMG-Cr₂O₃-Ag-BaF₂/CaF₂ coating.(이미지참조) 96
Fig. 3-2-2-4-3-5. Variation of Victors microhardness and porosity of the surface after as coating and the wear test according temperature. 96
Fig. 1. Brief description on materials spray processing and their characteristics 112
Fig. 2. Various nanostructured materials prepared by material spray processing. 113
Fig. 3. World wide industry structure (year 2003) 116
Fig. 4. Estimated world wide materials market 116
Fig. 5. Schematic diagram of spray dryer :... 122
Fig. 6. SEM image and XRD pattern of Al₂O₃-YAG(Al2O3-YAG) granule powder. 124
Fig. 7. SEM image of spray dried powders :... 125
Fig. 8. Effort of spray rotation speed and slurry feed rate on powder size. 126
Fig. 9. Effect of spray rotation speed on powder size. 127
Fig. 10. Effect of spray rotation speed on powder surface morphology. 128
Fig. 11. Effect of slurry feeding rate on powder size. 129
Fig. 12. Effect of atomizer disk size on powder size. 130
Fig. 13. Effect of chamber pressure on powder size distribution. 131
Fig. 14. Effect of chamber pressure on powder morphology. 132
Fig. 15. Effect of binder fraction in slurry on powder size. 133
Fig. 16. Effect of binder fraction in slurry on the fraction of defected powder. 134
Fig. 17. Effect of binder fraction in slurry on powder morphology. 134
Fig. 18. Effect of solid fraction in slurry on powder size. 136
Fig. 19. Effect of binder fraction in slurry on the fraction of defected powder. 137
Fig. 20. Effect of solid fraction in slurry on powder morphology and size distribution. 138
Fig. 21. Schematic describing plasma spraying 139
Fig. 22. Characteristics of gases used for plasma spraying 139
Fig. 23. Thermal profile of Plasma flame measured[38].(그림없음) 140
Fig. 24. Measured flame velocity[38].(그림없음) 140
Fig. 25. Experimentally measured flame temperature(a) and velocity(b) along the center line of flame. 141
Fig. 26. Calculated thermal history of Fe-Si amorphous powder in plasma thermal splaying. 141
Fig. 27. Calculated internal temperature of metallic powder with high thermal conductivity. 142
Fig. 28. Calculated relationship between (a) flight distance and flight velocity, (b) flight distance and flight time, (c) flight distance and heat transfer coefficient on powder surface.(그림없음) 143
Fig. 29. Grid generation in order to calculated internal temperature of powders which are assumed to be fixed in gas fluid. 144
Fig. 30. Calculated internal temperature of ceramic powders such as Y₂O₃(Y203) with low thermal conductivity. 144
Fig. 31. Schematics describing grid systems in order to calculate internal thermal history of powders which files through gas fluid. 145
Fig. 32. Reduced grid system in order to calculate heat transfer between powders and substrate, fluid flow of in-flight droplet after impingement on surface by assignment initial thermal and kinetical data as I.C. from simplified calculations. 145
Fig. 33. Fluid flow calculation of impinged droplets against surface. 146
Fig. 34. Calculation results of partially molten droplets which transform its shape to make newly developed coating surface. 146
Fig. 35. Visual aspect of Y₂O₃ coatings a)observed from the samples deposited on different spray distance and different deposition positions. and b) observed from the samples deposited under different coating conditions. 149
Fig. 36. (a) Temperature, and (b) fluid flow contour of plasma flame calculated for with tile plasma spraying conditions with Ar flow rate 36 l/min,H₂flowrate4l/min, current 750A, and voltage 50V. 150
Fig. 37. (a) The velocity of gas flame and in-flight droplet, (b) heat transfer coefficient of in-flight droplet, (c) flame temperature, and (d) temperature of in-flight droplet with 30mm diameter. 151
Fig. 38. Three different trajectories path A, B, and C considered in calculations(a).... 152
Fig. 39. The velocity of flame gas and in-flight droplet(a), the variation of H.T.C with distance(b), relationship between flight distance and flight time(c), the variation of H.T.C with time(d), plasma gas temperature with Bight distance(e), and plasma gas temperature with flight time(f). 154
Fig. 40. Calculated temperature profile inside of powders at flight time 0s(a), 0.00168s(b), and 0.00172s(c), where the thermal conductivity of solid was assumed as 0.5Wm-1K-1 for solid region and 5Wm-1K-1 for liquidus Y₂O₃.(이미지참조) 155
Fig. 41. The surface and center temperature variation of in-flight droplet calculated by considering thermal conduction inside of droplet, where the thermal conductivity of solid was assumed as 0.5 Wm-1K-1 and 5 Wm-1K-1 for liquidus Y₂O₃.(이미지참조) 155
Fig. 42. The calculated mean temperature at spray distance 120mm with variation of powder size, powder feeding position, initial gas velocity. gas conductivity, and plasma flame temperature at torch tip point. 156
Fig. 43. Experimentally measured results of flux, temperature, and velocity of in-flight droplets at spraying distance 120mm using Spray Watch™. 157
Fig. 44. Calculated droplet velocity(a) and droplet temperature with different drople4 diameter(b). 157
Fig. 45. Mean temperature of in-flight droplets passing along path A - Ccalculated at spray distance 120mm (a), and those calculated at different spray distance 100, 120, 150mm(b) along path C. 158
Fig. 46. (a) Outward appearance of granular Y₂O₃ powder composed of primary powders having diameter 1-3㎛, and (b) its magnified view. 158
Fig. 47. Surface and center temperature calculated with thermal conductivity of 1(a), 0.1(b), and 0.05 Wm -IK-1(c) for solid Y₂O₃, and 10 Wm -1K -1for liquid Y₂O₃.(이미지참조) 159
Fig. 48. Calculated temperature of primary particle attached on granule surface, which is compared to mean temperature of granule and plasma flame temperature. 160
Fig. 48. (a) Granular Y₂O₃ powders composed with 1-2㎛ primary powder and (b) over sprayed dense powder. 161
Fig. 49. (a) Naked eye view of Y₂O₃ coatings formed using over sprayed dense powder and its sectional view, (b) Naked eye view of Y₂O₃ coatings formed using granular porous powder and its sectional view. 161
Fig. 50. (a) Naked eye view of Y₂O₃ coatings formed using relatively fine power smaller than 38㎛ diameter and its sectional view, (b) Naked eye view of Y₂O₃ coatings formed using relatively fine powder lager than 38㎛ diameter and its sectional view. 162
Fig. 51. Schematics showing volume change and crystallization during solidification at melting temperature. 164
Fig. 52. Schematics showing vertical crack and splat boundary gap formation mechanism during spray deposition. 164
Fig. 53. (a) XRD analysis of Y₂O₃ coatings after plasma spray coating. and (b) sectional view of plasma spray coated Y₂O₃. 165
Fig. 54. Schematics showing volume change of materials which sustains random distribution of atoms even after solidification, where no urgent volume contraction is observed. 165
Fig. 55. Schematics showing no vertical crack and splat boundary gap formation in nano/amorphous structured coatings. 166
Fig. 56. (a) XRD analysis of newly developed NanoWin amorphous/nano structured coatings after plasma spray coating, and (b) sectional view of plasma spray amorphous/nano structured coatings. 166
Fig. 57. Numerical calculation results during left) gas atomization, middle) heating stage of plasma thermal spray, and c) cooling stage after deposition in plasma thermal spray. 167
Fig. 58. Schematic showing time-temperature-transformation curve. 168
Fig. 59. (a) XPS analysis resu14s of reaction products formed on Al₂O₃ coating exposed to low temperature plasma and corrosive CF₄+O₂+Ar(이미지참조) mixture gas and (b) its surface morphology. 168
Fig. 60. Modified cooling systems for internal type spray gun. 169
Fig. 61. Environmental controllable chamber for plasma splaying of metal or non-oxide ceramic materials prepared for 4he development of new corrosion resistant coating. 170
Fig. 62. The effects of plasma coating parameters on the hardness of newly developed nano/amorphous coating. 171
Fig. 63. The effect of powder feeding manner on the microstructure of conventional Y₂O₃ coating(upper) and newly developed nano/amorphous coating(lower). 171
Fig. 64. Phase diagram of Al₂O₃-Y₂O₃, and various selected compositions for nanocomposite coatings in this study. 173
Fig. 65. XRD patterns of Al₂O₃-Y₂O₃ nanocomposite powders manufactured by spray drying. 175
Fig. 66. SEM cross-sections and fractured surfaces of Y₂O₃ coatings from different powder feeding systems. 179
Fig. 67. Microhardness of Y₂O₃ coatings from different powder feeding systems. 180
Fig. 68. Scratch resistance of Y₂O₃ coatings from different powder feeding systems. 180
Fig. 69. Scratch resistance of Y₂O₃ coatings from different powder feeding systems. 181
Fig. 70. SEM micrographs of cross-section of Y₂O₃ coatings from different plasma jet power (a)32kW, (b)40kW, (c)45kW, and (d)50kw in external feeding system. 182
Fig. 71. Apparent porosity of Y₂O₃ coatings for plasma jet power. 182
Fig. 72. SEM micrographs of fractured surface of Y₂O₃ coatings from different plasma jet power (a)32kW, (b)40kW, (c)45kW, and (d)50kW. 183
Fig. 73. SEM micrographs of surface morphology of Y₂O₃ coatings from different plasma jet power (a)32kW, (b)40kW, (c)45kW, and (d)50kW. 183
Fig. 74. Apparent density of Y₂O₃ coatings for plasma jet power. 184
Fig. 75. Microhardness and corresponding Weibull plots of Y₂O₃ coatings from different plasma jet power. 185
Fig. 76. SEM micrographs of surface of (a)Al₂O₃, (b)Y₂O₃ coatings before and after ICP-RIE 186
Fig. 77. SEM micrographs of reaction products on (a)Al₂O₃, (b)Y₂O₃ coatings after ICP-RIE exposure for 10min. 186
Fig. 78. XRD patterns of (a)Al₂O₃, (b) Y₂O₃ coatings before and after ICP-RIE exposure. 187
Fig. 79. XPS analysis of reaction products on (a)Al₂O₃, (b)Y₂O₃ coatings before(thin line)/after(thick line) ICP-RIE exposure. 188
Fig. 80. XRD pattern of Al₂O₃-Y₂O₃ eutectic composition composite coating. 190
Fig. 81. SEM micrographs of Al₂O₃, Y₂O₃ eutectic composition composite coatings (a) 79%Al₂O₃-21%Y₂O₃, (b) 52.5%Al₂O₃-47.5%Y₂O₃, (c) 43%Al₂O₃-57%Y₂O₃ and (d) 29%Al₂O₃-71%Y₂O₃ 191
Fig. 82. Apparent density of Al₂O₃ -Y₂O₃ composite coatings 191
Fig. 83. Microhardness of Al₂O₃-Y₂O₃ composite coatings. 192
Fig. 84. Scratch resistance of Al₂O₃-Y₂O₃ composite coatings. 193
Fig. 85. Corrosion resistance of Al₂O₃-Y₂O₃ composite coatings against 2N HCl. 193
Fig. 86. DTA result of 79%Al₂O₃-21%Y₂O₃ coating. 195
Fig. 87. XRD patterns of 79%Al₂O₃-21%Y₂O₃ coatings heat-treated at 1000 to 1400℃ for 1h. 195
Fig. 88. SEM micrographs of cross-section of 79%Al₂O₃-21%Y₂O₃ coatings:... 196
Fig. 89. EDS analysis of 79%Al₂O₃-21%Y₂O₃ coatings heat-treated at (a) 1000℃ and (b) 1400℃ for 1h. 196
Fig. 90. SEM micrographs of cross-section at high magnification of 79%Al₂O₃-21%Y₂O₃ coating layers heat-treated at... 197
Fig. 91. TEM micrographs of 79%Al₂O₃-21%Y₂O₃ coatings heat treated at (a) 1000℃ and (b) 1400℃ for 1hour 197
Fig. 92. Density and microhardness of 79%Al₂O₃-21%Y₂O₃ coatings heat-treated at 1000 to 1400℃ for lh. 198
Fig. 93. SEM micrographs of surface of (a)62.5%Al₂O₃-37.5%Y₂O₃, (b)79%Al₂O₃-21%Y₂O₃ coatings before and after ICP-RIE. 199
Fig. 94. ICP-RIE plasma etching resistance of Al₂O₃-Y₂O₃ amorphous coatings. 200
Fig. 95. Chemical reaction products between Al₂O₃-Y₂O₃ amorphous coatings and CF4 plasma gas :... 201
Fig. 96. XPS analysis of (a)62.5%Al₂O₃-37.5%Y₂O₃ (b)79%Al₂O₃21%Y₂O₃ coatings before (thin line)/after(thick line) ICP-RIE. 201
Fig. 97. Etching rate if heat treated 79%Al₂O₃-21%Y₂O₃ coatings after ICP-RIE. 202
Fig. 98. XPS analysis of 79%Al₂O₃-21%Y₂O₃ :... 203
Fig. 99. XPS analysis of Al₂O₃-Y₂O₃ composite (62.5%Al₂O₃-37.5%Y₂O₃ and 79%Al₂O₃-21%Y₂O₃) coatings after(thick line) ICP-RIE. 203
Fig. 100. Schematic describing semi-conductor/LCD fabrication process. 206
Fig. 101. Schematics showing plasma density variation and potential gradient formation around wall or surface of parts. 209
Fig. 102. Schematic and characteristic of two different clamping. 210
Fig. 103. Some examples of semi-conductor or LCD fabrication equipments parts made of Al₂O₃(Al203) ceramic. 211
Fig. 104. Some examples of semi-conductor or LCD fabrication equipments parts made of quarts ceramic. 211
Fig. 105. Some examples of semi-conductor or LCD fabrication equipments parts made of metallic materials with ceramic coatings on it. 211
Fig. 106. Schematics describing how to increase life time of parts. 212
Fig. 107. Out appearance of plasma spray coating equipments, a) robot system, and b) control system. 213
Fig. 108. Metallic parts of dry etcher coated with ceramic(left) and nano structured coating(right). 213
Fig. 109. Ceramic parts of dry etcher or CVD thin film coating equipments coated with nano structured coating. 214
Fig. 110. Disk type metallic part coated with nano/amorphous structured coating, where numerous fine holes are formed. 214
Fig. 111. Magnified sectional view of coatings formed around holes, where coating exfoliation is seen(a) and no exfoliation is seen. 215
| 등록번호 | 청구기호 | 권별정보 | 자료실 | 이용여부 |
|---|---|---|---|---|
| T000025653 | 전자형태로만 열람가능함 | 이용불가 |
*표시는 필수 입력사항입니다.
| 전화번호 |
|---|
| 기사명 | 저자명 | 페이지 | 원문 | 기사목차 |
|---|
| 번호 | 발행일자 | 권호명 | 제본정보 | 자료실 | 원문 | 신청 페이지 |
|---|
도서위치안내: / 서가번호:

우편복사 목록담기를 완료하였습니다.
*표시는 필수 입력사항입니다.
저장 되었습니다.
