


권호기사보기
| 기사명 | 저자명 | 페이지 | 원문 | 기사목차 |
|---|
| 대표형(전거형, Authority) | 생물정보 | 이형(異形, Variant) | 소속 | 직위 | 직업 | 활동분야 | 주기 | 서지 | |
|---|---|---|---|---|---|---|---|---|---|
| 연구/단체명을 입력해주세요. | |||||||||
|
|
|
|
|
|
* 주제를 선택하시면 검색 상세로 이동합니다.
표제지
제출문
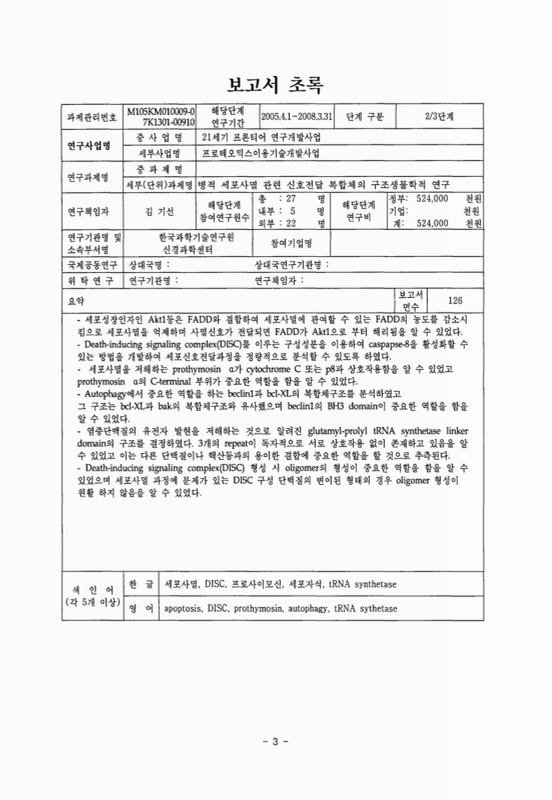
보고서 초록
요약문
SUMMARY
CONTENTS
목차
제1장 연구개발과제의 개요 16
제2장 국내외 기술개발 현황 18
제3장 연구개발수행 내용 및 결과 20
제1절 FADD의 상호작용 및 세포사멸 기작 20
제2절 FADD의 구조분석 49
제3절 세포사멸 복합체관련 단백질의 생산 및 분석 66
제4절 염증단백질 합성 저해 단백질 구조연구 99
제5절 단백질 형질 개선 111
제4장 목표 달성도 및 관련 분야에의 기여도 118
제5장 연구개발결과의 활용계획 120
제6장 연구개발과정에서 수집한 해외과학기술정도 122
제7장 참고문헌 124
그림 1. (A) Full length Akt1과 catalytic domain의 발현 실험, (B) GST-Akt1-PH의 정제, (C) MBP-Akt1-PH의 정제 21
그림 2. Binding assay of FADD, FADD-DD, FADD-DED to Akt1(full) by ELISA 23
그림 3. Binding assay of FADD, FADD-DD, FADD-DED to Akt1-PH by ELISA 24
그림 4. Binding assay of Akt1-PH to FADD-DD by Pull down 25
그림 5. Binding assay of Akt1-PH to FADD-DD by FPLC gel filtration 26
그림 6. Competition binding of Fas-DD and Akt1-PH to FADD-DD 29
그림 7. Binding assay of Ptdlns(3,4,5)P₃ to Akt1-PH by ELISA 30
그림 8. Competition binding of Ptdlns(3,4,5)P₃ and Akt1-PH to FADD-DD 31
그림 9. pH에 따른 death domain의 상호작용, (top) pH4.0(-), pH4.6 (o), (middle) pH4.8 (-), pH5.0(o), (bottom) pH6.0 (-), pH7.5(o).... 33
그림 10. Mutation에 따른 death domain이 oligomer형성에 영향.... 34
그림 11. Size-exclusion chromatogram of complex between GB1-Fas-DD (219-325) and human FADD-DD(93-192).... 35
그림 12. Size-exclusion chromatogram of complex between GB1-Fas-DD (219-335) and human FADD-DD(93-192). 36
그림 13. FADD의 death effector domain mutant의 열역학적 안정성(10mM NaPi, pH 7.5) F25Y/E65K가 가장 안정하며 F25Y/R71A가 가장 불안정하고, E65K변이를 추가하면 다시 안정해지는 것을 알 수 있음. 38
그림 14. GB1-FADD와 Fas-DD complex의 size exclusion chromatogram.... 39
그림 15. Refolding of Pro-caspase 8.... 41
그림 16. Procaspase-8 activation by DISC formation.... 42
그림 17. SDS-Page(left) and Western Blotting(right) of procaspase-8 activation. 43
그림 18. Effect of FADD mutations on the activation of procaspase-8.... 45
그림 19. SDS-PAGE analysis showing procaspase-8 activation.... 46
그림 20. Procaspase-8 activation by antibody induced aggregation of Fas-DD.... 47
그림 21. Delphi(15)를 이용하여 계산한 human(left)과 mouse(right) FADD의 surface charge 50
그림 22. F25Y FADD와 R71A/F25Y, R71A/E65K/F25Y FADD의 chemical shift의 변화 53
그림 23. Human FADD(H)와 mouse FADD(M)의 2차구조의 비교 55
그림 24. Human(blue) 과 mouse(red) FADD의 DED(left)와 DD(right) 부분의 비교 56
그림 25. Mouse FADD의 리본 구조 57
그림 26. 얻어진 20개의 ensemble을 DD를 기준으로 overlay한 결과 58
그림 27. Mouse FADD(1-183)의 heteronuclear NOE 59
그림 28. Mouse FADD의 N-H RDC value 60
그림 29. N-H RDC의 full FADD에서와 DD와 DED 에서의 histogram분석 61
그림 30. Ribbon representation of calculated structure of DED(left) and DD(right) in full-length FADD.... 62
그림 31/32. pH 6.8에서의 R71A E65K FADD의 HSQC spectrum 64
그림 32/33. Chemical shift가 변화된 부분의 human FADD를 이용하여 homology 모델링으로 만든 mouse FADD구조에서의 위치(red). Mutated residues (R71,E65) was marked as blue. 65
그림 33/34. PTMA 정체 후 SDS-PAGE gel 로 확인, VHB tag을 가지고 있는 PTMA의 단백질 크기는 약 29 kDa (VHB 17 kDa, PTMA 12.4 kDa)이다. 67
그림 34/35. HPLC를 이용한 prothymosin a 의 정제 68
그림 35/36. prothumosin a의 HSQC spectrum 69
그림 36/37. Zn 첨가에 따른 PTMA의 2차 구조 변화 관찰... 71
그림 37/38. Zn titration... 72
그림 38/39. Zn titration... 73
그림 39/40. Native gel을 이용한 p8과 prothymosin a의 결합체 형성관찰 75
그림 40/41. Prothymosin과 p8의 복합체 형성.... 76
그림 41/42. 15N HSQC spectra of p8 (red) and p8/prothymosin complex (green). 77
그림 42/43. p8 과 15N-labeled prothmosin a 의 complex 형성시 HSQC spectrum의 변화 관찰 78
그림 43/44. PTMA 와 cytochrome c의 complex 형성 유무 관찰 80
그림 44/45. Prothymosin a와 cytochrome c의 complex 유무 확인... 81
그림 45/46. Zn에 의한 PTMA와 cytochrome c의 결합체 형성유도 관찰 82
그림 46/47. PTMA와 cytochrome c의 결합체 형성 관찰... 83
그림 47/48. GB1-beclin1(red) 및 GB1-beclin1/bcl-XL 복합체(green)의 15N HSQC spectra. 85
그림 48/49. A. Analytical gel filtration assay at a flow rate of 0.5ml/min showing the binding of Beclin-1(wt) to Bcl-xl. A 2-fold molar excess of Bcl-xl was mixed with beclin-1(wt) and then injected onto a pre-equilibrated Superdex200 gel filtration column(20mM Sodium Phosphate, 150mM Nacl,1mM DTT,pH-7.5).... 86
그림 49/50. A. Analytical gel filtration assay at a flow rate of 0.5ml/min showing the binding of DBeclin-1 to Bcl-xl. A 2-fold molar excess of Bcl-xl was mixed with beclin-1(wt) and then injected onto a pre-equilibrated Superdex200 gel filtration column (20mM Sodium Phosphate, 150mM Nacl,1mM DTT,pH-7.5).... 87
그림 50/51. A. HSQC spectra of 15N-labeled Δbeclin-1 alone. B. Superimposed HSQC spectra of 15N-labeled(이미지참조) Δbeclin-1 with or wothout a saturating amount of unlabeled Bcl-xl. Binding of Δbeclin-1 induced chemical shift changes to a subset of peaks, indicating a direct interaction between Δbeclin-1and Bcl-xl 88
그림 51/52. A. 10% Native gel run in buffer, 25mM Tris, 192mM Glycine, pH 8.8 for 120mins in 90V at 40C for Beclin-1(wt) and Beclin-1(c-s) in presence and absence of DTT. B. Seperation of oxidized and reduce formof Beclin-1 by analytical gel filtration ata flow rate do 0.3ml/min in buffer, 20mM Sodium Phosphate, 150mM Nacl,1mM, DTT,pH-7.5. 90
그림 52/53. A. Analytical gel filtration assay at a flow rate of 0.5ml/min showing that Beclin-1(wt) and Beclin-1(c-s) interact similarly to Bcl-xl.... 91
그림 53/54. A. Analytical gel filtration assay at a flow rate of 0.5ml/min showing that by addition of increasing concentration of Δbeclin-1 also failed to interact with Mcl-1.... 92
그림 54/55. A. Surface representation of Bcl-xl indication the mutated residues.... 93
그림 55/56. A. Analytical gel filtration assay at a flow rate of 0.5ml/min showing that Δbeclin-1 failed to interact with Bcl-xl mutant R139A.... 94
그림 56/57. A. Analytical gel filtration assay at a flow rate of 0.5ml/min showing that Δbeclin-1 interact with Bcl-xl mutant L194A.... 95
그림 57/58. A. SDS-PAGE analysis of Bcl-xl, BBDCCD and UVCCD, Molecular weight + observed are indicated in the figure. V\B. Sequence of BBDCCD and UVCCD inserted into the construct. 97
그림 58/59. A. Analytical gel filtration assay at a flow rate of 0.5ml/min showing the individiual protein chromatogram of BBDCCD, UVCCD and Bcl-xl and the triple complex.... 98
그림 59/60. (A) EPRS linker domain을 pET28a에 넣고, Ndel과 Xhol을 이용하여 cloning, (B) EPRS linker domain expression test. 100
그림 60/61. (A) Ni-NTA chromatography 한 결과 (50mM, 100mM immidazole elution 선택), (B) HPLC 한 최종 결과 101
그림 61/62. (A) GAIT element (U87C : mutant), (B) Acidic native gel electrophoresis.... 103
그림 62/63. 전형적인 helical NOE pattern을 가진 15N-NOESY(이미지참조) spectrum 105
그림 63/64. Ribbon representation of R1 (left) and R1R2R3 (right). 107
그림 64/65. EPRS linker domain 과 linker domain + GAIT element binding의 15N-HSQC 비교 109
그림 65/66. EPRS R1R2R3 15N-HSQC spectrum의 peak intensity와 GAIT element 와 결합 후 얻은 spectrum의 peak intensity와의 상대적인 비교 110
그림 66/67. GFP와 융합단백질의 형광분석.... 112
그림 67/68. AIMP3의 생산.... 113
그림 68/69. Gel filtration에 의한 AIMP3의 상태분석.... 114
그림 69/70. AIMP3의 열역학적 안정성.... 115
그림 70/71. AIMP3의 15N-HSQC spectra.... 117
*표시는 필수 입력사항입니다.
| 전화번호 |
|---|
| 기사명 | 저자명 | 페이지 | 원문 | 기사목차 |
|---|
| 번호 | 발행일자 | 권호명 | 제본정보 | 자료실 | 원문 | 신청 페이지 |
|---|
도서위치안내: / 서가번호:

우편복사 목록담기를 완료하였습니다.
*표시는 필수 입력사항입니다.
저장 되었습니다.
