


권호기사보기
| 기사명 | 저자명 | 페이지 | 원문 | 기사목차 |
|---|
| 대표형(전거형, Authority) | 생물정보 | 이형(異形, Variant) | 소속 | 직위 | 직업 | 활동분야 | 주기 | 서지 | |
|---|---|---|---|---|---|---|---|---|---|
| 연구/단체명을 입력해주세요. | |||||||||
|
|
|
|
|
|
* 주제를 선택하시면 검색 상세로 이동합니다.
표제지
제출문
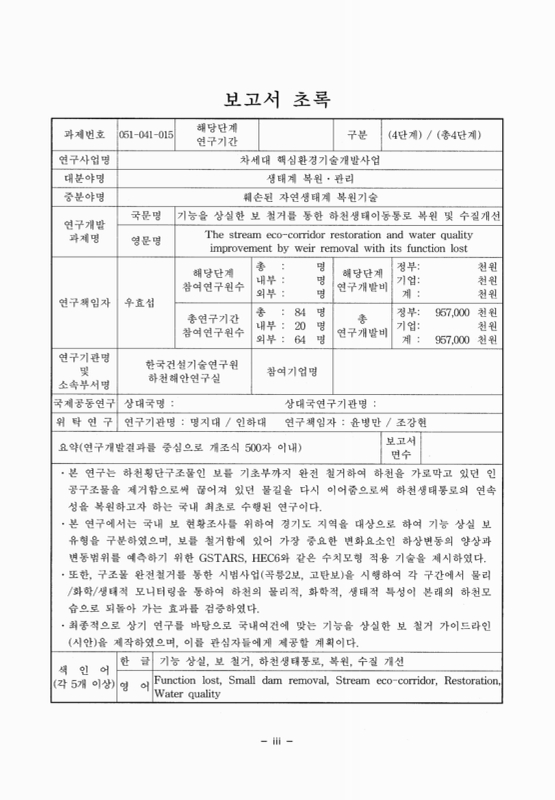
보고서 초록
요약문
SUMMARY
CONTENTS
목차
제1장 서론 38
1절. 연구의 배경 및 목적 40
1. 연구의 배경 40
2. 연구의 목적 41
2절. 연구의 목표와 주요내용 42
1. 연구의 목표 42
2. 연구의 주요 내용 43
3. 연차별 연구 주요내용 47
3절. 연구개발 달성도 48
제2장 국내외 관련 기술의 현황 50
1절 국내외 보 철거 연구 동향 52
2절 국외 보/댐 철거 사례 55
1. 미국의 소규모 댐 철거 사례 55
2. 일본의 소규모 댐 철거 사례 64
3. 프랑스의 소규모 댐 철거 사례 67
3절 외국의 보 철거 사례가 주는 시사점 71
1. 미국의 보 철거가 주는 시사점 71
2. 일본의 보 철거가 주는 시사점 72
제3장 보 철거 의사결정 기준 분석 74
1절 국외 소규모 댐/보 철거 기준 76
2절 보 철거 관련 요소 고찰 81
3절 국내여건에 맞는 보 철거 의사결정 체계 및 기준 86
제4장 보 철거에 따른 영향 예측기법 개발 90
1절 보 철거에 따른 하상변동예측기법 92
1. 장단기 하상변동 예측기법(HEC-6, GSTARS 등) 92
2. 하상변동 모형예측 103
2절 오염저니 이송예측 및 처리기법 118
1. 오염 저니의 이송예측 기법 118
2. 오염저니의 처리·처분기법 136
3절 보 철거 후 하천생물서식처 변화 예측 146
1. 생물 서식처 변화예측 연구의 필요성 146
2. 보 철거 후 생물 환경의 변화 예측 148
3. 보 철거 후 종합적 생태계의 변화 예측 149
4. 보 철거 후 생물상 변화 예측 151
제5장 하천생태통로 복원 기술 162
1절. 하천 생물서식처 복원 기술 현황 164
1. 보 철거에 따른 생물서식처 복원 기술의 필요성 164
2. 보 철거에 따른 생물서식처 복원 기술 및 생태적 복원방안 165
2절. 하천 생태통로 조성 기술 168
1. 국내외 하천 생태통로 조성 기술 168
2. 국내외 보 개량 조성 기술 178
제6장 기능을 상실한 보 철거 시범사업 182
1절. 보 철거 시범사업의 의의 184
1. 시범사업 대상지의 개요 184
2. 철거를 위한 행정적 절차 및 유지관리 186
2절 곡릉천 곡릉2보 철거 시범사업 193
1. 곡릉2보 철거에 따른 물리적 영향분석 193
2. 곡릉2보 철거에 따른 화학적 영향분석 210
3. 곡릉2보 철거에 따른 생태적 영향분석 216
3절 한탄강 고탄보 철거 시범사업 235
1. 고탄보 철거에 따른 물리적 영향분석 235
2. 고탄보 철거에 따른 화학적 영향분석 249
3. 고탄보 철거에 따른 생태적 영향분석 251
제7장 연구개발 결과의 활용계획 266
1절 결론 및 시사점 268
2절 연구개발 성과 270
1. 논문게제(국내) 270
2. 논문발표 270
3절 연구성과의 확산 및 보급 273
1. 연구개발 성과의 보급 273
2. 연구개발 성과의 확산 277
2.1. 보 철거 가이드라인 제작 및 보급 277
2.2. 경기도의 후속 지원현황 279
4절 활용방안 및 예상효과 281
1. 연구개발 성과의 활용분야 및 활용방안 281
2. 파급효과 및 기대효과 282
참고문헌 284
부록 292
부록 1. 곡릉천 곡릉2보 철거 전후 사진 모니터링 294
부록 2. 한탄강 고탄보 철거 전후 사진 모니터링 298
부록 3. 곡릉2보 철거 전후의 생물상 비교 304
부록 4. 고탄보 철거 전후의 생물상 비교 310
기능/용도를 상실한 보 철거 가이드라인(시안/Tentative Edition) 317
머리말 318
집필진 319
〈목차〉 320
제1장 서론 325
1.1. 보 철거 의의 325
1.2. 용어 정의 326
1.3. 한국의 보 현황 326
제2장 보(소형 댐) 철거 사례 328
2.1. 미국 328
2.2. 프랑스 333
2.3. 일본 337
2.4. 국내 340
제3장 보 철거 절차 343
3.1. 국외 소형 댐/보 철거 기준 343
3.2. 보 철거 의사결정 과정 347
제4장 보 철거 영향 분석 예측 352
4.1. 영향 분석 예측 개요 352
4.2. 물리적 영향 분석 예측 354
4.3. 생태적 영향 분석 예측 369
4.4. 사회·경제적 영향 분석 예측 381
제5장 보 철거 및 개선 공법 385
5.1. 완전 철거 385
5.2. 부분 철거 385
5.3. 대안 시설 387
제6장 모니터링 389
6.1. 모니터링의 중요성 389
6.2. 모니터링 항목 및 방법 389
제7장 결론 396
참고문헌 398
부록 1. 곡릉2보 철거 시범 사업 400
1.1. 곡릉2보 개요 401
1.2. 철거를 위한 행정적 절차 401
1.3. 보 철거 과정 및 유지관리 402
1.4. 곡릉2보 철거에 따른 물리/화학/생태적 영향 406
부록 2. 한탄강 고탄보 철거 시범 사업 411
2.1. 고탄보 개요 412
2.2. 철거를 위한 행정적 절차 412
2.3. 보 철거 과정 및 유지관리 413
2.4. 고탄보 철거에 따른 물리/화학/생태적 영향 416
Fig. 2.1. Jackson Street Dam 57
Fig. 2.2. McPherrin Dam 59
Fig. 2.3. Welch Dam 60
Fig. 2.4. Rock Hill Dam 62
Fig. 2 5. Anaconda Dam 63
Fig. 2.6. Quaker Neck Dam 64
Fig. 2.7. Wakaayukyo Dam 65
Fig. 2 8. Upstream Reach of Wakaayukyo Dam, Before Removal 65
Fig. 2.9. Upstream Reach of Wakaayukyo Dam, After Removal 66
Fig. 2.10. Mannen Dam 66
Fig. 2.11. Maison-Rouges Dam Removal Site(European Rivers Network, 2005) 68
Fig. 2 12. Saint-Etienne du Vigan Dam - before removal(European Rivers Network, 2005) 70
Fig. 2.13. Saint-Etienne do Vigan Dam - during removal(European Rivers Network, 2005) 70
Fig. 3.1. General Method for Dam Removal Decisions (The Heinz Center, 2002) 77
Fig. 3.2. Retirement Evaluation Process (ASCE, 1997) 79
Fig. 3.3. Dam Removal Decision Process *American Rivers and Trout Unlimited, 2002) 80
Fig. 3.4. General Decision Making Process for Small Dam Removal in Korea 86
Fig. 4.1. Control Volume 94
Fig. 4.2. Schematic diagram of Energy equation 95
Fig. 4.3. Schematic diagram of bed change 96
Fig. 4.4. Schematic diagram of stream tube in GSTARS 99
Fig. 4.5. Unsteady discharge hydrograph approximated by a series constants discharge bursts 100
Fig. 4.6. longitudinal profile and project a flood stage of Gokreungchun conference site(2002년) 103
Fig. 4.7. longitudinal profile ground level compare of Gokreung2-Bo site(2006년) 103
Fig. 4.8. Gokreungchun section No.97(Gokreung2-Bo upstream) bed grading curve 104
Fig. 4.9. Gokreungchun section No.94(Gokreung2-Bo downstream) bed grading curve 104
Fig. 4.10. Gokreungchun section No. 92bed grading curve 104
Fig. 4.11. Section No. 94 low dam removal the vicinity of bed grading curve 105
Fig. 4.12. Section No. 97 low dam removal the vicinity of bed grading curve 105
Fig. 4.13. Rating curve at Gokreungchun Beawl-Bo 106
Fig. 4.14. Discharge calculated from water level at Gokreungchun Beawl-Bo in 2006 106
Fig. 4.15. Flow duration curve at Gokreung2-Bo 106
Fig. 4.16. Comparison of bed variation field data and calculated data 2006/05 107
Fig. 4.17. Comparison of bed variation field data and calculated data 2006/08 107
Fig. 4.18. Bo removal vicinity of bed variation result comparison and analysis 108
Fig. 4.19. Bo removal later 1 year(2007) bed variation comparison and analysis 108
Fig. 4.20. Bo removal later 10 year(2016) bed variation comparison and analysis 109
Fig. 4.21. Bo removal later 20 year(2026) bed variation comparison and analysis 109
Fig. 4.22. Later Bo removal upstream(left), downstream(right) annually bed variation 109
Fig. 4.23. Long-term bed variation to HEC-6 model prediction result (2016Year) 109
Fig. 4.24. Long-term bed variation to HEC-6 model prediction result (2026Year) 109
Fig. 4.25. River discharge at Gokreung2-Bo 111
Fig. 4.26. Flood event at Gokreung2-Bo 111
Fig. 4.27. River discharge at Gotan-Bo 111
Fig. 4.28. stage-discharge curve at Gotan-Bo 111
Fig. 4.29. Comparison of GSTARS result and observed extreme river bed elevation 113
Fig. 4.30. Change in bed elevation along the profile 113
Fig. 4.31. GSTARS result at No. 91+33 114
Fig. 4.32. GSTARS result at No. 93+59 114
Fig. 4.33. GSTARS result at No. 95+09 114
Fig. 4.34. GSTARS result at No. 95+60 114
Fig. 4.35. GSTARS result at No. 98+03 114
Fig. 4.36. GSTARS result at No. 99+12 114
Fig. 4.37. Comparison of GSTARS result and observed extreme river bed elevation 115
Fig. 4.38. Change in bed elevation along the profile 115
Fig. 4.39. GSTARS result at No. 110 116
Fig. 4.40. GSTARS result at No. 113 116
Fig. 4.41. GSTARS result at No. 114+17 116
Fig. 4.42. GSTARS result at No. 114+54 116
Fig. 4.43. GSTARS result at No. 115+55 116
Fig. 4.44. GSTARS result at No. 118 116
Fig. 4.45. Representation of terms in energy equarion 121
Fig. 4.46. Representation of weir-type links 123
Fig. 4.47. Schematic representation of the dispersion model 125
Fig. 4.48. Schematic representation of modeled river reach 131
Fig. 4.49. Results of the steady flow model 131
Fig. 4.50. Results of the steady flow model 133
Fig. 4.51. Dispersion coefficients 135
Fig. 4.52. Results of the dispersion model 135
Fig. 4.53. Purification method of polluted sediments 141
Fig. 4.54. Theoretical relationship between the level of stresser by dam and ecological integrity. 147
Fig. 4.55. Conceptional model of the changes in stream geomorphology after the dam removal. 148
Fig. 4.56. Changes in stream ecosystems with time and space after dam removal. 150
Fig. 4.57. General changes of vegetations and their environments after dam removal. 152
Fig. 4.58. Changes in number of species and growth forms of plants after dam removal. 153
Fig. 4.59. Changes of the numbers of present and characteristic species befoe and after the Gokreung-2-Dam removal. 159
Fig. 4.60. Changes of the numbers of the endemic species befoe and after the Gokreung-2-Dam removal. 160
Fig. 5.1. The process of ecosystem after the dam removal. 164
Fig.5.2. The techniques of riverbed used storage tank 168
Fig. 5.3. The restoration techniques of instream ecosystem 169
Fig. 5.4. The techniques of stairs type fishway 169
Fig. 5.5. The techniques of ripple makeup 170
Fig. 5.6. The techniques of ripple makeup block 171
Fig. 5.7. The techniques of fishway makeup block 171
Fig. 5.8. The techniques of multiple-technical block in river 172
Fig. 5.9. The ecosystem restoration techniques in mam-made river 172
Fig. 5.10. The techniques of ripple type floodgate 173
Fig. 5.11. The eco-corridor techniques of drop structure 173
Fig. 5.12. The techniques of sewage dis-posal facilities in river 174
Fig. 5.13. The techniques for water-purity control and eco habitat 174
Fig. 5.14. The eco-corridor techniques in waterway 175
Fig. 5.15. The techniques of bench type underwater-construction for fish 175
Fig. 5.16. The techniques of underwater control construction for fish 176
Fig. 5.17. The bench type underwater-construction techniques 176
Fig. 5.18. The techniques of waterglass block for fish move 177
Fig. 5.19. The techniques of underwater weir construction for ecosystem 177
Fig. 5.20. A reformed weir type 1 178
Fig. 5.21. A reformed weir type 2 178
Fig. 5.22. A reformed weir type 3 179
Fig. 5.23. A reformed Sabo dam for eco-corridor 179
Fig. 5.24. The bench type fish way for eco-corridor 180
Fig. 5.25. The fan type fish way for eco-corridor 180
Fig. 5.26. The Seseragi type fish way for eco-corridor 181
Fig. 5.27. The drop structure reformed eco-corridor for fish 181
Fig. 6.1. The location map of gokreung 2 small dam removal demonstration project 184
Fig. 6.2. The location map of Gotan small dam removal demonstration project 185
Fig. 6.3. The scene of explanation for local resident 186
Fig. 6.4. Make up the entry road for dam removal(Gokreung 2 small dam) 149 187
Fig. 6.5. The removal Gokreung 2 small dam 187
Fig. 6.6. Scrapped material broke out according to the Gokreung 2 small dam removal 188
Fig. 6.7. The scene of bank of Gokreung 2 small dam before and after the dam removal 188
Fig. 6.8. The images of Gokreung 2 small dam before and after the dam removal 189
Fig. 6.9. Make up the entry road for dam removal(Gotan small dam) 190
Fig. 6.10. The removal Gotan small dam 191
Fig. 6.11. Scrapped material broke out according to the Gotan small dam removal 191
Fig. 6.12. The images of Gotan small dam before and after the dam removal 192
Fig. 6.13. Watershed map of Gokreungcheon 194
Fig. 6.14. Hypsomatric curve 194
Fig. 6.15. Hypsomatric curve of Gokreungcheon and tributaries 194
Fig. 6.16. Monthly average precipitation of Gokreungcheon a drainage basin(1961~2000) 195
Fig. 6.17. 2006Year Monthly precipitation 195
Fig. 6.18. Daily precipitation(07. 2006.) 196
Fig. 6.19. Water natural resources and flow duration curve 196
Fig. 6.20. Location map of study site and Kokreung2-Bo 197
Fig. 6.21. Design of Gokreung2-Bo 197
Fig. 6.22. Structures of Gokreung2-Bo site 198
Fig. 6.23. View of cross section point 199
Fig. 6.24. Change of observed profile bed elevation 200
Fig. 6.25. Change of bed elevation at No. 3 202
Fig. 6.26. Change of bed elevation at No. 4 202
Fig. 6.27. Change of bed elevation at No. 5 203
Fig. 6.28. Change of bed elevation at No. 6 203
Fig. 6.29. Change of bed elevation at No. 10 203
Fig. 6.30. View of weir at No. 12 203
Fig. 6.31. Grain size Change of D50(이미지참조) 204
Fig. 6.32. Component ratio of river bed material (before and after removal, after flood) 205
Fig. 6.33. View of monitoring site 206
Fig. 6.34. M1 Change of site 207
Fig. 6.35. M2 Change of site 207
Fig. 6.36. M3 Change of site 208
Fig. 6.37. M4 Change of site 208
Fig. 6.38. The density variation of SS & BOD at Gokreung2-bo 213
Fig. 6.39. The density variation of TP & TN at Gokreung2-bo 213
Fig. 6.40. Size distribution of sediments KL1 ~ KL3 of Gokreung2-bo 214
Fig. 6.41. Comparisons of the numbers of plants with different growth forms in the upstream and downstream of Gokreung-2-Dam and their reference reach before and after the dam removal. 221
Fig. 6.42. Comparisons of percentages of the numbers of annual and biennial plants in the upstream and downstream of Gokneung-2-Dam and their reference reach before and after the dam removal. 221
Fig. 6.43. Changes of vegetation map after the dam removal at the Gokreung-2-Dam. 223
Fig. 6.44. Changes of vegetation profile after the dam removal at the Gokreung-2-Dam. 224
Fig. 6.45. Compositions of substrate compositions at sampling sites before and after the dam removal of Gokreung-2-Dam. 225
Fig. 6.46. Changes of species richness of benthic macroinvertebrates at the Gokreung-2-Dam in the Gokreung Stream. 226
Fig. 6.47. Changes of Shannon species diversity indices (H') of benthic macroinvertebrates before and after the Gokreung-2-Dam removal. 228
Fig. 6.48. Changes of McNaughton's dominance indices (DI) of benthic macroinvertebrates before and after Gokreung-2-Dam removal. 228
Fig. 6.49. Changes of ecological score for the water quality by benthic invertebrates before and after Gokreung-2-Dam removal. 229
Fig. 6.50. Composition of habitat oriented groups of benthic macroinvertebrates before and after the Gokreung-2-Dam removal. 231
Fig. 6.51. Comparisons of the ecological naturalness before and after the Gokreung-2-Dam removal 234
Fig. 6.52. Watershed map of Hantan River 235
Fig. 6.53. Flow duration curve at end of Hantan River 236
Fig. 6.54. Location map of study site and Gotan-Bo 237
Fig. 6.55. View of cross section point 238
Fig. 6.56. Change of observed profile bed elevation 238
Fig. 6.57. Change of profile elevation and flowing shape by dam removal 240
Fig. 6.58. Change of bed elevation at No. 109 241
Fig. 6.59. Change of bed elevation at No. 111 241
Fig. 6.60. Change of bed elevation at No. 113+41 242
Fig. 6.61. Change of bed elevation at No. 113+84 242
Fig. 6.62. Change of bed elevation at No. 114 242
Fig. 6.63. Change of bed elevation at No. 114+17 242
Fig. 6.64. Change of bed elevation at No. 114+21 243
Fig. 6.65. Change of bed elevation at No. 115 243
Fig. 6.66. View of River bed material around Gotan-Bo (left-upstream, right-downstream) 244
Fig. 6.67. Grading curve... 244
Fig. 6.68. View of monitoring site 245
Fig. 6.69. Change at M1 site 246
Fig. 6.70. Change at M2(bela) site 246
Fig. 6.71. Change at M2 site (a~c), and flooding(d) 247
Fig. 6.72. The density variation of SS & BOD at Gotan-Bo 250
Fig. 6.73. The density variation of TP & TN at Gotan-Bo 250
Fig. 6.74. Comparisons of the numbers of plants with different growth forms in the upstream and downstream of Gotan-Dam and their reference reach before and after the dam removal. 216 253
Fig. 6.75. Comparisons of percentages of the numbers of annual and biennial plants in the upstream and downstream of Gotan-Dam and their reference reach before and after the dam removal. 253
Fig. 6.76. Changes of vegetation map before and after the dam removal at the Gotan-Dam (to be continued). 254
Fig. 6.77. Comparisons of the species richness of benthic macroinvertebrates before and after the Gotan-Dam removal in Hantan river. 258
Fig. 6.78. Comparisons of percentage composition of benthic macroinvertebrate taxa before and after the Gotan-Dam removal, Hantan river. 258
Fig. 6.79. Changes of Shannon species diversity indices(H') of benthic macroinvertebrates before and after Gotan weir removal in Hantan river. 260
Fig. 6.80. Changes of ecological score of benthic invertebrates (ESB) before and after the Gotan-Dam removal in Hantan river. 261
Fig. 6.81. Composition of function feeding groups of benthic macroinvertebrates before and after the Gotan-Dam removal in Hantan river. 262
Fig. 6.82. Composition of habitat oriented groups of benthic macroinvertebrates before and after the Gotan-Dam removal in Hantan river. 262
Fig. 6.83. Comparisons of the ecological naturalness before and after the Gotan-Dam removal 265
기능/용도를 상실한 보 철거 가이드라인(시안/Tentative Edition) 322
그림 1.1. 국내 보 증가현황(2002년 기준) 327
그림 1.2. 보 높이별 폐기 현황(2002년) 327
그림 2.1. Jackson Street Dam(American Rivers 등, 1999) 330
그림 2.2. Rock Hill Dam(American Rivers 등, 1999) 331
그림 2.3. Quaker Neck Dam(American Rivers 등, 1999) 333
그림 2.4. Maison-Rouges Dam 철거 전경(European Rivers Network, 2005) 334
그림 2.5. Saint-Etienne du Vigan Dam - 철거 전(European Rivers Network, 2005) 336
그림 2.6. Saint-Etienne du Vigan Dam - 철거 중(European Rivers Network, 2005) 336
그림 2.7. 일본의 보 철거 현황(2001년 4월) 337
그림 2.8. 무기천 보 철거 전(좌)과 보 철거 후(우) 338
그림 2.9. 무기천 보 상류 고수부지 현황 338
그림 2.10. 비젠마에호리천(備前前堀川) 만년보(万年堰)... 339
그림 2.11. 카시오강 낙차공... 339
그림 2.12. 경안천 오포대교보... 340
그림 2.13. 곡릉천 곡릉2보... 340
그림 2.14. 한탄강 고탄보... 341
그림 2.15. 전주천 덕진보... 342
그림 3.1. 일반적인 댐 철거 의사결정 과정(The Heinz Center, 2002) 344
그림 3.2. 댐 철거 평가 과정(ASCE, 1997) 345
그림 3.3. 댐 철거 결정 과정(American Rivers와 Trout Unlimited, 2002) 346
그림 3.4. 보 철거 의사 결정 과정 348
그림 4.1. D-74 수심적분 부유사채취기(우효섭, 2001) 356
그림 4.2. Helly-Smith 소류사채취기(우효섭, 2001) 356
그림 4.3. 평면현황도 358
그림 4.4. 하천의 기하학적 형태(우효섭, 2001) 358
그림 4.5. 보 주변의 지형 변화 사진... 359
그림 4.6. 하천의 사주형태(다지, 직류, 곡류하천)(우효섭, 2001) 359
그림 4.7. 체분석 시험기 및 격자틀(저울, 분석체, 격자틀) 360
그림 4.8. 보 철거에 따른 생태계의 시간적 및 공간적 변화(Hart 등, 2002) 370
그림 4.9. 보에 의한 스트레스 요인의 수준과 생태적 온전성(Hart 등, 2002) 371
그림 4.10. 보 철거에 따른 물리적 환경과 식생의 변화(Shafroth 등, 2002) 373
그림 5.1. 부분 철거된 Anaconda Dam... 386
그림 5.2. 보의 부분 철거 방법 387
그림 1.1. 곡릉2보 위치도 401
그림 1.2. 지역주민대표 설명회(2006년 3월) 402
그림 1.3. 보 철거를 위한 진입로 조성(2006년 4월) 403
그림 1.4. 보 본체 철거(2006년 4월) 403
그림 1.5. 보 철거에 따른 폐기물처리(2006년 4월) 404
그림 1.6. 보 철거 후 주변 제방부 복원(좌: 복원 전, 우: 복원 후)(2006년 4월) 404
그림 1.7. 곡릉2보 철거 현장 405
그림 1.8. 곡릉2보 철거에 따른 수위 변화(1.0 m)(2006년 4월) 405
그림 1.9. 종단 하상변동 406
그림 1.10. 측량단면 입도분포도 407
그림 1.11. 곡릉2보 철거 전후 BOD 및 SS 농도 변화 407
그림 1.12. 보 철거 전후의 식생 변화 408
그림 1.13. 보 철거 전후의 저서동물 변화 409
그림 1.14. 곡릉2보 철거 후 소상한 어류(좌: 메기, 우: 참게)(2006년 11월) 410
그림 2.1. 한탄강 고탄보 위치도 412
그림 2.2. 보 철거를 위한 가물막이보/오탁방지막 및 진입로 설치(2007년 6월) 413
그림 2.3. 고탄보 보 본체 철거(2007년 6월) 414
그림 2.4. 보 철거에 따른 폐기물 처리(2007년 6월) 414
그림 2.5. 고탄보 철거 현장 415
그림 2.6. 고탄보 철거에 의한 수위 변화(0.6 m)(2007년 10월) 415
그림 2.7. 종단 하상변동 416
그림 2.8. 입도분포의 변화 417
그림 2.9. 고탄보 보 철거에 따른 보 상하류 수질 특성분석 417
그림 2.10. 고탄보 보 철거 전후의 식생 변화 418
그림 2.11. 고탄보 보 철거 전후의 저서동물 변화 418
그림 2.12. 고탄보 보 철거 전후의 어류 변화 419
*표시는 필수 입력사항입니다.
| 전화번호 |
|---|
| 기사명 | 저자명 | 페이지 | 원문 | 기사목차 |
|---|
| 번호 | 발행일자 | 권호명 | 제본정보 | 자료실 | 원문 | 신청 페이지 |
|---|
도서위치안내: / 서가번호:

우편복사 목록담기를 완료하였습니다.
*표시는 필수 입력사항입니다.
저장 되었습니다.
