


권호기사보기
| 기사명 | 저자명 | 페이지 | 원문 | 기사목차 |
|---|
| 대표형(전거형, Authority) | 생물정보 | 이형(異形, Variant) | 소속 | 직위 | 직업 | 활동분야 | 주기 | 서지 | |
|---|---|---|---|---|---|---|---|---|---|
| 연구/단체명을 입력해주세요. | |||||||||
|
|
|
|
|
|
* 주제를 선택하시면 검색 상세로 이동합니다.
표제지
제출문
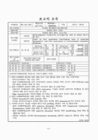
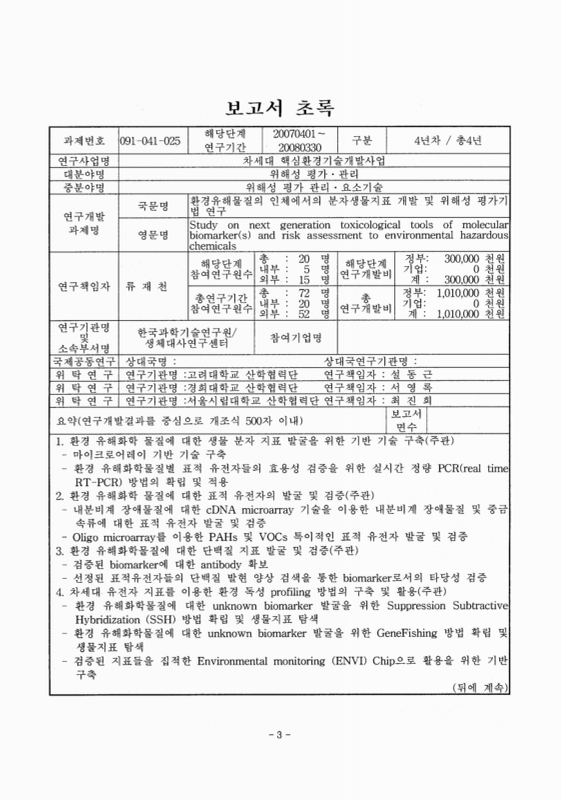
보고서 초록
요약문
SUMMARY(영문요약문)
CONTENTS
목차
제1장 연구개발과제의 개요 36
제1절 연구개발의 중요성 및 필요성 38
1. 기술적 측면 39
2. 경제·산업적 측면 39
3. 사회·문화적 측면 39
제2절 연구개발의 목표 및 내용 40
1. 최종목표 40
2. 평가방법 및 평가항목 40
3. 연차별 주요 사업 내용 및 범위 43
제2장 국내외 기술개발 현황 46
제1절 국내 기술개발 현황 48
제2절 국외 기술개발 현황 48
제3절 국내외 유사기술과의 차별성 49
제3장 연구개발수행 내용 및 결과 52
제1절 환경 유해화학 물질에 대한 생물 분자 지표 발굴을 위한 기반 기술 구축(주관) 54
1. 상보적 DNA 마이크로어레이(cDNA microarray) 기반 기술 구축 54
2. 올리고뉴클레오타이드 마이크로어레이(Oligonucleotide microarray) 기반 기술 구축 57
3. 환경 유해화학물질별 표적 유전자들의 효용성 검증을 위한 실시간 정량 PCR(real time RT-PCR) 방법의 확립 및 적용 59
제2절 환경 유해화학 물질에 대한 표적 유전자의 발굴 및 검증(주관) 65
1. 내분비계 장애물질에 대한 cDNA microarray 기술을 이용한 표적 유전자 발굴 및 검증 65
2. 중금속류에 대한 cDNA microarray 기술을 이용한 표적 유전자 발굴 및 검증 80
3. Oligo microarray를 이용한 다환성 방향족 탄화수소류(PAHs) 특이적인 표적 유전자 (Characteristic Differentially Expressed(Expresssed) Genes; DEGs) 발굴 및 검증 90
4. Oligo microarray를 이용한 휘발성 유기 화합물(VOCs) 특이적인 표적 유전자 (Characteristic Differentially Expressed(Expresssed) Genes; DEGs) 발굴 및 검증 105
제3절 환경 유해화학물질에 대한 단백질 지표 발굴 및 검증(주관) 112
제4절 차세대 유전자 지표를 이용한 환경 독성 profiling 방법의 구축 및 활용(주관) 116
1. 환경 유해화학물질에 대한 unknown biomarker 발굴을 위한 Suppression Subtractive Hybridization (SSH) 방법 확립 및 생물지표 탐색 116
2. 환경 유해화학물질에 대한 unknown biomarker 발굴을 위한 GeneFishing 방법 확립 및 생물지표 탐색 126
3. 검증된 지표들을 집적한 Environmental monitoring (ENVI) Chip으로 활용을 위한 기반 구축 145
제5절 환경유해물질 2,3,7,8-TCDD 및 2,3,4,7,8-PCDF의 인간 간세포주(HepG2)분비 독성 단백체 지표 개발연구(1위탁) 151
제6절 환경 유해물질 2,3,7,8-tetrachloro dibenzo-p-dioxin (TCDD) 및 2,3,4,7,8-polychloro dibenzo furan(PCDF)의 쥐(Rat) 혈장 독성 단백체 지표 개발연구(1위탁) 163
제7절 세포분자생물학적 기법을 이용한 비교적 용이하고 신속한 DNA repair를 생물지표로 하는 분석기술 구축 연구(2위탁) 170
제8절 DNA repair 유전자의 전사적 활성을 분자적 지표로 하는 새로운 위해성 평가기법 개발(2위탁) 178
제9절 환경유해화학물질에 대한 산화적 스트레스의 분자지표 발굴을 위한 기반 기술 구축 연구 (3위탁) 185
제10절 각 범주별 환경 유해화학물질별 산화적 스트레스 지표 선정(3위탁) 199
제11절 다양한 범주의 유해화학물질에 산화적 스트레스 지표를 적용(3위탁) 220
제12절 환경 유해화학 물질군별 유전자 발현 프로파일 체계화 및 database 구축(주관) 235
1. DNA chip 지원 인프라 구축 235
2. 환경 유해 화학물질군별 유전자 발현 profile 정립 및 data 표준화 235
제4장 목표 달성도 및 관련분야에의 기여도 238
제1절 연구개발목표의 달성도 240
제2절 평가의 착안점에 따른 목표달성도에 대한 자체평가 242
제5장 연구개발결과의 활용계획 244
제6장 연구개발과정에서 수집한 해외과학기술정보 248
제7장 참고문헌 252
그림 1. 실시간 정량 PCR 방법의 모식도 59
그림 2. Real time RT PCR에 의한 정량 원리 60
그림 3. -dF/dT vs. temperature plot displaying melting peaks of amplified PCR product. 63
그림 4. Melt curve graph of selenoprotein W (left) and selenoprotein P (right) 64
그림 5. KISTCHIP-400의 유전자 구성, 개발과정 및 validation 결과 65
그림 6. Effects of 17-estradiol, BPA and 4-NP on proliferation of MCF-7 cells 68
그림 7. Estrogen-responsive genes.... 76
그림 8. Quantitative determination of transcript levels by real-time PCR. 78
그림 9. 환경중 노출 농도의 Mixture 형태에서의 E-Screen Assay 결과 79
그림 10. human 8k cDNA microarray (Digital genomics Co.) 80
그림 11. Change of morphology of SH-SY5Y cells treated MeHg 83
그림 12. Result of MTT assay in SH-SY5Y cells treated to MeHg at 3, 6, 12, 24, 48, 72 hr,7 days. 83
그림 13. Identification of genes differentially expressed by MeHg on each time points.... 85
그림 14. Regulation of Selenoprotein W (SeW) by MeHg, (A) result of time course microarry by MeHg on SeW (B, C) Dose and time dependent down regulation of SeW by MeHg in SH-SY5Y cells (D) mRNA expression patterns of other selenoenzymes by MeHg in SH-SY5Y cells (E) relationship between SeW mRNA expression and... 86
그림 15. mRNA expression of early and late response genes in cells treated 1.4 uM MeHg examined in each time points. 87
그림 16. Effects of other heavy metal on mRNA level of selenoprotein W and intracellular glutathione level in the human neuroblastoma cells 88
그림 17. Comparison of Expression profile on Selenoenzymes in human neuroblastoma and astrocytoma cells 89
그림 18. Result of MTT assay in HepG2 cells treated to 벤조에이파이렌(benzo[a]yrene; B[a]P), 다이벤조에이에이취안트라센(dibenzo[a,h]anthracene; DB[a,h]A), 3-메틸콜란트렌(3-methylcholanthrene; 3MC), 나프탈렌(naphthalene; NP) for 48 hr. 95
그림 19. 4종의 다환성 방향족 탄화수소류(PAHs)에 의한 유전자 발현 양상 96
그림 20. 4종의 다환성 방향족 탄화수소류(PAHs) 류에 의해 공통적으로 고발현 (Up: 30유전자) 혹은 저발현 (Down: 106 유전자) 되는 유전자들 98
그림 21. 4종의 다환성 방향족 탄화수소류(PAHs) 에 대한 특이적인 표적유전자(DEG)의 functional clustering 98
그림 22. Effect of formaldehyde on HL-60 cells viability. 108
그림 23. HL-60 cell에서 Formaldehyde에 의한 유전자 발현 양상 (n=3) 109
그림 24. HL-60 cell에서 Formaldehyde에 의해 발현이 증가하고 감소하는 유전자들의 기능별 분류 110
그림 25. Results of Western blot on alkylphenol responsive proteins (Matrix Gla protein (MGP), H2A histone family/member X(H2AFX), breast_cancer_1 _early_onset (BRCA1)) in MCF-7 cells treated to 17b-estradiol (17b), bisphenol A (BPA), nonylphenol(NP) and octylphenol (OP) for 24h and 48h. 114
그림 26. Suppression Subtractive hybridization 방법의 개요 116
그림 27. Scheme of suppression subtractive hybridization method 117
그림 28. Primary and secondary PCR products of subtracted cDNA separated on a 2% TAE agarose gel.... 122
그림 29. (A) Plasmid prepared from white colony which candidates for DEG were coloned with T/A cloning vector; (B) Dot blot analysis of differential screened gene clones after SSH.... 123
그림 30. Confirmation of differentially expressed genes by MeHg using Real time RT-PCR 125
그림 31. ACP 구조. 128
그림 32. cDNA합성과 GeneFishing PCR protocol에 대한 flow chart 129
그림 33. Normal 및 canncer tissue를 GeneFishing 방법을 이용하여 DEG screening한 결과의 예시 129
그림 34. Effect of formaldehyde on Jurkat cells viability. 132
그림 35. Detection of formaldehyde -induced DNA strand breaks in Jurkat cells by the Comet assay. 133
그림 36. 포름알데히드에 대한 GeneFishing 결과... 134
그림 37. Effect of malachite green on HepG2 cells viability. 138
그림 38. Differentially expressed genes by malachite green in HepG2 cells using Genefishing methods 140
그림 39. The effect of malachite green on either early or late stage of HepG2 apoptosis as detected by flow cytometry. 144
그림 40. ENVI Chip의 Design 및 유전자 배열 모식도 149
그림 41. ENVI Chip의(Chip 의) real image 150
그림 42. ENVI chip의 spotting 검증을 위한 Syto61 test 결과 150
그림 43. MTT assay in HepG2 exposed to 2,3,7,8-TCDD and 2,3,4,7,8-PCDF 154
그림 44. LDH assay in HepG2 exposed to 2,3,7,8-TCDD and 2,3,4,7,8-PCDF 155
그림 45. DNA damage in HepG2 exposed to 2,3,7,8-TCDD and 2,3,4,7,8-PCDF 155
그림 46. 기존 2-DE (24x20cm) 시스템과 Long gel 시스템 (35x45cm)의 분해능 비교 결과 156
그림 47. Long gel 시스템 (35x45cm)에서의 분해능 증대로 인한 시료주입량 향상 결과 156
그림 48. 2-DE pattern of secreted proteins from HepG2 exposed to 2,3,7,8-TCDD and 2,3,4,7,8-PCDF 157
그림 49. 2-DE pattern and Image analysis of secterted proteins in HepG2 exposed to 2,3,7,8-TCDD 158
그림 50. 2-DE pattern and Image analysis of secterted proteins in HepG2 exposed to 2,3,4,7,8-PCDF 159
그림 51. 2-DE pattern and Image analysis of secterted proteins in HepG2 exposed to 2,3,7,8-TCDD and(뭉) 2,3,4,7,8-PCDF 160
그림 52. 2,3,7,8-TCDD 와 2,3,4,7,8-PCDF 단백체 지표들의 상호 연관성 161
그림 53. Band of western blot in HepG2 cell by 2,3,4,7,8-TCDD treatment 162
그림 54. Band of western blot in HepG2 cell by 2,3,4,7,8-PCDF treatment 162
그림 55. 2-DE pattern of plasma proteins of rats 165
그림 56. 2-DE pattern of plasma proteins of rats exposed to 2,3,7,8-TCDD and 2,3,4,7,8-PCDF 166
그림 57. 2-DE pattern and Image analysis of rat plasma proteins exposed to 2,3,7,8-TCDD 및 2,3,4,7,8-PCDF 167
그림 58. 2-DE(Fig 13. 2-DE) pattern and Image analysis of rat plasma proteins exposed to 2,3,7,8-TCDD 및 2,3,4,7,8-PCDF 168
그림 59. Nickel-induced cytotoxicity (MTT assay) 173
그림 60. No effect of cell cycle progression with lower dose Nickel-treated RKO cells 174
그림 61. Effect of MMS exposure time on AP site in MMS-treated cells 175
그림 62. MMS-induced DNA repair in RKO cells 176
그림 63. Low concentration of 20 uM Nickel exposure inhibits MMS-induced DNA repair 176
그림 64. DNA repair process interfere in Nickel-treatment cell using 6-4 pps ELISA assay 177
그림 65. Effect of Nickel treatment on the transcriptional activation of DNA repair gene Gadd45a in RKO cells 180
그림 66. Effect of Nickel treatment on the transcriptional activation of DNA repair gene APE in RKO cells 181
그림 67. Interaction of PCNA-Gadd45a interfered by Nickel 182
그림 68. 환경유해물질에 의한 분자독성을 제거하는데 필수적인 DNA repair protein system 중 PCNA 단백질과 Gadd45a 단백질 간의 결합 가능한 부위를 보여주는 3차 구조 이미지 183
그림 69. 환경유해물질에 의한 분자독성을 제거하는데 필수적인 dNA repair protein system의 모식도 183
그림 70. Gadd45a와 APE1의 상호작용에 따른 DNA repair 모델 제시 (Oncogene 2007) 184
그림 71. 동물 세포주 185
그림 72. 지표 생물종 185
그림 73. 인공토양에서의 C. elegans 급성 독성 실험 과정 187
그림 74. K-media에서의 C. elegans 급성 독성 실험 과정 187
그림 75. Chironomus의 급성 독성 실험 모습 188
그림 76. C. elegans의 생리학적 실험 결과 관찰 모습 189
그림 77. HepG2세포에서의 BPA, NP 급성 독성 실험 결과 190
그림 78. HeLa 세포에서의 CP, ES, PQ 급성 독성 실험 결과 190
그림 79. 다양한 오염물질노출로 인한 C. elegans의 성장 저해 실험 결과 (24시간 노출) 195
그림 80. 다양한 오염물질노출로 인한 C. elegans의 생식 저해 실험 결과 (24시간 노출) 196
그림 81. Cd, NP, BPA 에 96시간 동안 노출된 C. elegans의 발달 저해 실험 결과... 197
그림 82. PQ, ES, FT, CP에 96시간 동안 노출된 C. elegans의 발달 저해 실험 결과... 198
그림 83. Microarray과정 199
그림 84. DNA 손상 분석 실험 199
그림 85. GeneFishing™ DEG 200
그림 86. comet assay 201
그림 87. 중금속류에 노출된 C. elegans의 스트레스 관련 유전자 발현 실험 결과 (control=1, number=3; mean ± standard error of the mean; *p < 0.05). 204
그림 88. 프탈레이트와 알킬페놀류에 노출된 C. elegans의 스트레스 관련 유전자 발현 실험 결과 (control=1, number=3; mean ± standard error of the mean; *p < 0.05) 205
그림 89. 농약류에 노출된 C. elegans의 스트레스 관련 유전자 발현 실험 결과 (control=1, number=3; mean ± standard error of the mean; *p < 0.05) 206
그림 90. C.tentans의 DNA 손상(NP, B[a]P, CP) and C.riparius의 DNA 손상(NP) 207
그림 91. D.magna의 DNA 손상 208
그림 92. 노닐페놀에 노출된 C. elegans를 이용한 DEG(differentially expressed genes)분석 (1, control ; 2, NP 0.1mg/L). 209
그림 93. Cd에 노출된 C. elegans를 이용한 DEG(differentially expressed genes)(DEGdifferentially expressed genes))분석 (1, control ; 2, Cd 8.5mg/L). 210
그림 94. 동물 세포주 HeLa 와 HepG2의 catalase 측정G. Benzo[a]pyrene (HepG2) 211
그림 95. C. elegans의 catalase 측정 212
그림 96. D. magna의(D. magna 의) catalase 측정 212
그림 97. 동물세포 HeLa의 GPx 측정 213
그림 98. 동물 세포주 HeLa의 SOD 측정 214
그림 99. 동물 세포주 HeLa와 HepG2의 지질과산화 측정 215
그림 100. Chironomus에서의 MDA측정 215
그림 101. C. ripirus에서의 지질과산화 측정 216
그림 102. C. elegans에서의 지질과산화 측정 216
그림 103. 유해화학물질 (NP, BPA, B[a]P)에 D. magna를 노출 시킨 후 헤모글로빈내 헤모글로빈 및 단백질 용량의 변화를 관찰 217
그림 104. 열충격 단백질과 녹색형광단백질을(녹색형관단백질을) 이용한 형질전환 C. elegans의 환경유해물질에 대한 반응 218
그림 105. 형질전환(형질전화) C. elegans (hsp-16.2::GFP and hsp-16.48::GFP)의 Cd 농도에 따른 형광 발광 측정 219
그림 106. Western blot 실험 과정 221
그림 107. 나노물질 SiO2 (7, 10 and 14 nm)와 CeO2 (15, 30 and 45 nm)를 처리한 Beas-2B 세포의 생존율 (n = 3, mean ± standard error of the mean) 224
그림 108. 나노물질 SiO2 (7, 10 and 14 nm)와 CeO2 (15, 30 and 45 nm) 처리한 세포의 세포사를 Flow cytometry를 이용하여 측정 224
그림 109. 나노물질 SiO2 (7, 10 and 14 nm)와 CeO2 (15, 30 and 45 nm)를 Beas-2B세포에 처리한 후 HO-1과 Cu/Zn SOD 단백질의 발현을 Western blot으로 측정... 225
그림 110. 나노물질 SiO2 (7, 10 and 14 nm)와 CeO2 (15, 30 and 45 nm)에 의한 ROS 생성을 DCFH-DA를 이용하여 관찰 225
그림 111. 나노물질 SiO2 (7, 10 and 14 nm)와 CeO2 (15, 30 and 45 nm)를 Beas-2B세포에 처리한 후 NFk-B, IkB and Nrf-2 단백질 발현을 Western blot으로 측정...(이미지참조) 226
그림 112. 나노물질 SiO2 (7, 10 and 14 nm)와 CeO2 (15, 30 and 45 nm)를 Beas-2B세포에 처리한 후 ERK, p38 and JNK단백질 발현을 Western blot으로 측정... 226
그림 113. PCDDs/PCDFs를 24시간 처리한 동물세포 Beas-2B에서 살펴본 AhR 유전자의 발현측정 (control=1, n=16, mean ± standard error of the mean) *p < 0.05 227
그림 114. PCDDs/PCDFs를 24시간 처리한 동물세포 Beas-2B에서 살펴본 CYP 유전자의 발현측정 (control=1, n=16, mean ± standard error of the mean) *p < 0.05 228
그림 115. PCDDs/PCDFs를 24시간 처리한 동물세포 Beas-2B에서 살펴본 TR과 HO-1 유전자의 발현측정 (control=1, n=16, mean ± standard error of the mean) *p < 0.05 228
그림 116. PCDDs/PCDFs를 24시간 처리한 동물세포 Beas-2B에서 살펴본 CuSOD와 MnSOD 유전자의 발현측정 (control=1, n=16, mean ± standard error of the mean) *p < 0.05 229
그림 117. PCDDs/PCDFs를 24시간 처리한 동물세포 Beas-2B에서 살펴본 p21과 p53 유전자의 발현측정 (control=1, n=16, mean ± standard error of the mean) *p < 0.05 229
그림 118. PCDDs/PCDF시료를 24시간 처리한 Beas-2B세포의 세포사 관찰 231
그림 119. DEHP에 노출된 매립지 토양 G, M, J에 노출된 C. elegan를 이용한 급성, 성장, 생식 독성(A)과 스트레스 관련 유전자의 발현양 조사(B) 녹색형광 단백질과 열충격 단백질의 재조합을 통해 얻어진 형질전환 C. elegans종을 이용한 형광의 발현양 조사(C). 233
*표시는 필수 입력사항입니다.
| 전화번호 |
|---|
| 기사명 | 저자명 | 페이지 | 원문 | 기사목차 |
|---|
| 번호 | 발행일자 | 권호명 | 제본정보 | 자료실 | 원문 | 신청 페이지 |
|---|
도서위치안내: / 서가번호:

우편복사 목록담기를 완료하였습니다.
*표시는 필수 입력사항입니다.
저장 되었습니다.
