권호기사보기
| 기사명 | 저자명 | 페이지 | 원문 | 기사목차 |
|---|
| 대표형(전거형, Authority) | 생물정보 | 이형(異形, Variant) | 소속 | 직위 | 직업 | 활동분야 | 주기 | 서지 | |
|---|---|---|---|---|---|---|---|---|---|
| 연구/단체명을 입력해주세요. | |||||||||
|
|
|
|
|
|
* 주제를 선택하시면 검색 상세로 이동합니다.
표제지
제출문
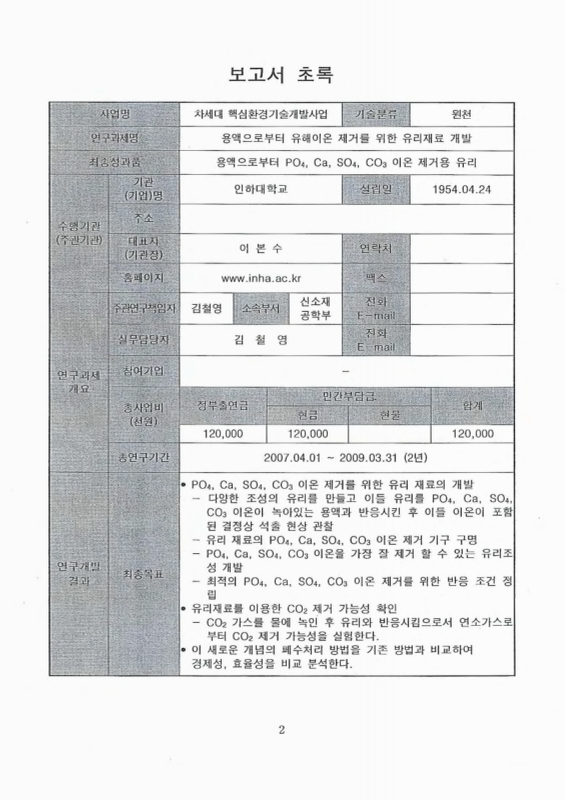
보고서 초록[개인신상정보 삭제]
목차
제1장 서론 19
1. 연구개발의 중요성 및 필요성 19
2. 연구개발의 국내외 현황 26
3. 연구개발대상 기술의 차별성 33
제2장 연구개발의 목표 및 내용 35
1. 연구의 최종목표 35
2. 연도별 연구개발의 목표 및 평가 방법 35
3. 연도별 추진체계 37
제3장 연구개발의 결과 및 활용계획 38
제1절 실험방법 38
1. 유리 용융 및 시편의 제작 38
2. 반응 용액의 제조 및 용액 반응 실험 38
3. 용액 반응 후 유리 시편의 표면분석 41
4. 용액 내의 이온 농도 측정 42
제2절 PO₄ 이온 제거를 위한 유리재료 개발 44
1. 붕규산염 유리의 PO₄ 이온 제거 44
2. 붕규산염 유리의 PO₄ 이온 제거 기구 48
3. 유리 분말시편의 입도 변화에 따른 PO₄ 이온 제거 54
4. 유리의 CaO 함량에 따른 PO₄ 이온 제거 57
5. 초기 이온농도 변화 60
6. 반응 용액의 초기 pH 영향 60
7. 정적·동적 반응조건의 영향 63
8. 표면적의 영향 67
9. silica-rich 층의 확인 67
10. 용액에 추가로 첨가된 PO₄ 이온 제거 실험 71
11. 유리 조성중의 B₂O₃함량이 PO₄ 이온 제거에 미치는 영향 73
12. 유리 분말 양의 변화 80
13. 실제 폐수에 대한 실험 84
제3절 Ca 이온 제거를 위한 유리재료 개발 86
1. 열처리 온도에 따른 유리의 결정화와 용액 중 Ca 이온의 제거 86
2. 동적반응의 영향 95
3. 표면적의 영향 95
4. 반응을 마친 용액 중 잔류이온의 농도 96
5. 분말반응 실험 100
제4절 SO₄ 이온 제거를 위한 유리재료 개발 102
1. 유리 표면으로 황산염 결정의 석출 102
2. 2가 알칼리토 금속 산화물의 종류에 따른 황산이온 제거 105
3. B₂O₃ 함량이 용액으로부터 황산이온 제거에 미치는 영향 108
4. 정적·동적 반응조건의 영향 110
5. 붕규산염 유리의 황산이온 제거 한계 112
6. 반응 용액의 초기 pH 영향 116
7. 황산이온 제거 기구 119
8. 실제 폐수에 대한 실험 125
제5절 CO₃ 이온 제거를 위한 유리재료 개발 128
1. 유리 표면으로 탄산염 결정의 형성 128
2. 유리조성 중의 SrO 함량이 CO₃ 이온 제거에 미치는 영향 134
3. 유리조성에서 B₂O₃ 함량이 CO₃ 이온 제거에 미치는 영향 137
4. 반응시간에 따른 CO₃ 이온 제거 변화 140
5. 유리를 이용한 CO₂ gas 제거 140
제6절 유리를 이용한 PO₄, NH₄ 동시제거 150
1. 서론 150
2. 실험방법 151
3. 실험 결과 및 토의 153
가. 유리 조성에서 MgO 함량에 따른 PO₄ 이온 제거 153
나. NH₄ 이온 농도 변화에 따른 결정 형성 변화 157
다. 유리조성에서 SiO₂ 함량이 PO₄ 이온 제거에 미치는 영향 161
라. 반응용액의 초기 PO₄ 이온농도 변화에 따른 NH₄ 이온 제거 165
마. 유리조성에서 P₂O5(이미지참조) 함량의 영향 166
바. P₂O5(이미지참조)를 포함한 유리의 NH₄이온 제거 171
사. 초기 pH가 이온제거에 미치는 영향 175
아. 실제폐수의 적용 실험 178
제7절 연구개발 결과 및 활용계획 180
1. 연구개발 결과 요약 180
2. 연도별 연구개발 목표의 달성도 183
가. 1차년도 183
(1) 연구개발목표의 달성도 183
(2) 평가의 착안점에 따른 목표달성도에 대한 자체 평가 183
나. 2차년도 184
(1) 연구개발목표의 달성도 184
(2) 평가의 착안점에 따른 목표달성도에 대한 자체 평가 184
3. 연도별 연구성과 185
가. 논문게재 성과 185
나. 특허 성과 185
다. 공개세미나 성과 185
라. 학술대회 발표 성과 186
4. 관련분야의 기술발전 기여도 187
가. 기술적 측면 187
나. 환경적 측면 187
다. 경제·산업적 측면 188
5. 연구개발 결과의 활용계획 189
6. 향후 연구내용 190
가. 경제성 향상을 위한 폐유리의 재활용에 대한 연구 190
나. 반응 후 폐유리의 회수방안 및 생성 결정의 재활용에 대한 연구 190
다. 실제 현장 적용에 대한 연구 191
제4장 참고문헌 192
제5장 공개세미나 및 외부 전문가 평가 결과 196
1. 공개세미나 개최 결과 196
2. 공개세미나 안내 자료 198
3. 공개세미나 발표자료 202
4. 공개세미나 발표 사진 214
5. 전문가 평가결과 215
Fig. 1. Solubility curve of calcium salt 22
Fig. 2. Scale formation in industrial pipes 23
Fig. 3. Schematic of removal of hazardous ions from the solution by glass material 34
Fig. 1-1. Three types of reaction methods 40
Fig. 2-1. Concentrations of phosphate ions remaining in the solution after reaction for 1 minute and 5 minutes with 1g of each glass powder with different B₂O₃ content in a range of 10 to 50 mole%. 46
Fig. 2-2. Concentration of phosphate ion remaining in the solution after reaction for 6hr and 48hr with bulk glass with different B₂O₃ content in a range of 10 to 50 mole%. 47
Fig. 2-3. Concentrations of phosphate ions remaining in the solution after reaction for various times with 1 piece of bulk glass with 20 mole% of B₂O₃. 49
Fig. 2-4. Thin film XRD patterns of B20 glass surfaces reacted with phosphate ion-containing solution with pH 3.0 for various times under the dynamic condition. 51
Fig. 2-5. FT-IRRS spectras of B20 glass surfaces reacted with phosphate ion-containing solution with pH 3.0 for various times under the dynamic condition. 52
Fig. 2-6. SEM micrographs of B20 glass surface reacted with phosphate ion-containing solution with pH 3.0 for various times under the dynamic condition. 53
Fig. 2-7. Schematic diagram for the mechanism of phosphate ion removal. 55
Fig. 2-8. Concentrations of phosphate ions remaining in the solution after reaction for various times with 1g of B20 glass powder with different particle size. 56
Fig. 2-9. Concentrations of phosphate remaining in the solution after reaction for 1 minute with 1g of each glass with different CaO content in a range of 10 to 35 mole%. 59
Fig. 2-10. Concentration of phosphate ions removed after reaction of glass powder with various CaO content in the solution with various initial phosphate ions for 1 minute. 61
Fig. 2-11. Concentrations of removed phosphate ions with various initial pH of the solution after reaction with two pieces of 25CaO glass for 40 hours. 62
Fig. 2-12. Concentrations of phosphate ions remaining in the solution after reaction with two pieces of 25CaO glass for various times, under static and dynamic conditions. 64
Fig. 2-13. Thin film XRD patterns of 25CaO glass surfaces reacted with phosphate ion-containing solution with pH 2.0 for various times under (a) the dynamic condition and (b) the static condition. 65
Fig. 2-14. SEM micrographs of 25CaO glass surface reacted with solution containing phosphate ions for various times under (a) the static condition and (b) the dynamic condition. 66
Fig. 2-15. Concentrations of phosphate ions remaining in the solution against the surface area of the samples to solution volume ratio(S/V) are plotted after 10 hours of reaction under the dynamic condition. 68
Fig. 2-16. Concentrations of phosphate ions remaining in the solution after reaction with 1g of 25CaO glass powder for various times. 69
Fig. 2-17. SEM and EDS results of the hydroxyapatite crystal layer and the original bulk glass after breaking off the deposited layer. 70
Fig. 2-18. SEM and EDS results of the silica-rich layer and the original bulk glass after immersion in HCl solution with a pH 1 to remove hydroxyapatite. 70
Fig. 2-19. Concentrations of phosphate ions remained in the solution after reaction times of 2, 5 and 10 minutes with 1g of each glass powder with different B₂O₃ content in a range of 0 to 50 mole%. 75
Fig. 2-20. Concentrations of phosphate ions remained in the solution after reaction with various initial phosphate concentrations of the reacting solution with 1g of each glass powder for 5 minutes. 76
Fig. 2-21. Thin film XRD patterns of the surfaces of glasses with different B₂O₃ content in a range of 0 to 50 mo1e% reacted in a phosphate ion-containing solution with pH 3.0 for 12 hours. 78
Fig. 2-22. FT-IR spectra of the surfaces of glasses with different B₂O₃ content in a range of 0 to 50 mo1e% reacted in a phosphate ion-containing solution with pH 3.0 for 12 hours. 79
Fig. 2-23. SEM micrograph of 40B glass surface reacted with phosphate ion-containing solution with pH 3.0 for 12 hours. 81
Fig. 2-24. Transmission electron diffraction pattern (a) and EDX result (b) of the clusters on the 40B glass after reaction with phosphate ion-containing solution with pH 3.0 for 12 hours. 82
Fig. 2-25. Concentrations of phosphate ions remaining in the solution after reaction with different amounts of 20B and 40B glass powders for 2 and 30 minutes. 83
Fig. 3-1. Powder XRD patterns of glass surface after heat treatment at various temperatures for 1 hour. 87
Fig. 3-2. Concentrations of calcium ions removed in the solution after reaction for 5 minutes with heat treated glass at various temperatures. 89
Fig. 3-3. Powder XRD patterns of glass surface after heat treatment at 550℃ for 1 hour and 6hours. 90
Fig. 3-4. Concentrations of calcium ions removed in the solution after reaction for 5 minutes with heat treated glass at 550℃ for 1hr and 6hr. 91
Fig. 3-5. Thin film XRD patterns of glass surface reacted with a solution containing calcium ion containing solution. 93
Fig. 3-6. SEM images of glass surface reacted with a solution containing calcium ion. 94
Fig. 3-7. Concentration of calcium ions remaining in the solution after reaction with different stirring speed for various times. 97
Fig. 3-8. Concentrations of calcium ions remaining in the solution against the surface area of the samples are plotted after 12 hours and 24 hours. 98
Fig. 3-9. Concentrations of calcium and phosphate ions remaining in the solution against the surface area of the samples are plotted after 24 hours. 99
Fig. 3-10. Concentrations of calcium ions remaining in the solution after reaction with 50ppm Ca solution and tap water for various times. 101
Fig. 4-1. Concentration of sulfate ions remaining in the solution containing 1000ppm of sulfate ion with pH1.O after reaction for various times with Ba20B bulk glass. 103
Fig. 4-2. Thin film XRD patterns and SEM micrographs of Ba20B glass surface after reaction with solution containing 1000ppm of sulfate ions. 104
Fig. 4-3. Concentration of sulfate ions removed from the solution after reaction with bulk glass and glass powder with four different divalent ions for 1hour and 1minute. 107
Fig. 4-4. Sulfate ion concentration remained after reaction with glass containing different B₂O₃ contents for various times. 109
Fig. 4-5. Concentrations of sulfate ions remaining in the solution after reaction with Ba20B bulk glass and glass powder for various times, under static and dynamic conditions. 111
Fig. 4-6. Concentration of sulfate ions removed from the solution containing 1000ppm of sulfate ions after reaction with different amount of Ba20B glass powder for 1minute. 113
Fig. 4-7. Concentration of sulfate ions removed from the solution containing 10000ppm of sulfate after reaction with 1g of Ba20B glass powder for various times. 114
Fig. 4-8. FT-IR spectra of Ba20B glass surfaces reacted in a solution containing 10000ppm of sulfate ions with pH 1.0 for very short reaction times. 115
Fig. 4-9. Concentration of sulfate ions removed after reaction with 1g of Ba20B glass powder in a solution with various initial pH for 1 minute. 117
Fig. 4-10. FT-IR spectra of Ba20B glass surfaces reacted in a solution containing 10000ppm of sulfate ions with various pH for 30 seconds. 118
Fig. 4-11. Morphology of cross section of BaSO₄ crystal on the Ba20B glass after reaction in a solution containing 10000ppm of sulfate ions with pH 1.0 for 40 minutes. 120
Fig. 4-12. EDS result of non-reacted glass surface (a) and reacted glass surface (b) 121
Fig. 4-13. EDS line profile of Si, Na, Ba and S of cross-section of Ba20B glass reacted in a solution containing 10000ppm of sulfate ion with pH 1.0 for 40 minutes. 122
Fig. 4-14. Thickness of barium sulfate crystal layer on the Ba20B glass after reaction in a solution containing 10000ppm of sulfate ions with pH 1.0 for various reaction times. 123
Fig. 4-15. SEM micrograph of BaSO₄ crystal on the Ba20B glass surfaces reacted in a solution containing 10000ppm of sulfate ions with pH 1.0 for 40 minutes. 124
Fig. 4-16. Schematic diagram for the mechanism of sulfate ion removal. 126
Fig. 4-17. Concentration of sulfate ions removed from wastewater after reaction with 1g of Bs20B glass powder for 10min. 127
Fig. 5-1. Carbonate ion concentration removed from the solution after reaction with different divalent ion containing glass for 1 hour. 131
Fig. 5-2. Thin film XRD patterns Sr0B glass surface after reaction with solution containing 1000ppm of carbonate ions. 132
Fig. 5-3. FT-IR spectra of Sr0B glass surfaces reacted in a solution containing 1000ppm of carbonate ions. 133
Fig. 5-4. Carbonate ion concentration removed from the solution after reaction with four glasses which containing different SrO contents in the range of 5-35 mole% for 1 hour. 136
Fig. 5-5. Carbonate ion removal efficiency of the glasses which containing different B₂O₃(B2O3) contents when the glasses were reacted with a solution containing 1000ppm of carbonate ions for 1hour. 139
Fig. 5-6. Concentration of carbonate ion remained after reaction with 40B-40Sr glass powder for various times. 141
Fig. 5-7. Thin film XRD pattern of Sr20B glass surface after reaction with saturated CO₂ gas solution for 1 hour. 143
Fig. 5-8. Thin film XRD patterns of Sr20B glass after reaction with continuous injected CO₂ solution for various times. 145
Fig. 5-9. Thin film XRD pattern of Sr20B glass after reaction with continuous injected CO₂ solution for 20 hours. 146
Fig. 5-10. Thin film XRD pattern of Sr20B glass after reaction with continuous injected CO₂-KOH solution for 2 hours. 147
Fig. 5-11. Thin film XRD pattern of Sr20B glass after reaction with saturated CO₂ gas solution and 0.5% AMP solution for 1 hour. 149
Fig. 6-1. Concentrations of phosphate ions remaining in the solution after reaction for 3hours and 12 hours with bulk glass with different contents of SiO₂ in a range of 20 to 30mole%. 155
Fig. 6-2. Concentrations of phosphate ions remaining in the solution after reaction of bulk glass with reaction solution containing 900ppm and 1500ppm of phosphate ions. 156
Fig. 6-3. Concentrations of removed phosphate ions with various initial ammonium ions of solution after reaction with 22.5Mg bulk glass for 12hours. 158
Fig. 6-4. Thin film XRD patterns of 22.5Mg glass surfaces reacted with reaction solution containing phosphate ions and various initial ammonium ions for 12hours. 159
Fig. 6-5. SEM images of 22.5Mg glass surfaces reacted with reaction solution (a)containing only phosphate ions and (b)containing phosphate and ammonium ions under static condition for 12hour. 160
Fig. 6-6. Concentrations of phosphate and ammonium ions remaining in the solution after reaction of bulk glass with different contents of SiO₂ in a range of 5 to 30mole% for 12hours. 163
Fig. 6-7. SEM and EDS results of the (a)Struvite crystal and (b)silica-rich layer. 164
Fig. 6-8. Concentrations of phosphate and ammonium ions remaining in the solution after reaction with 1g of 15Si glass powder with various initial concentrations of phosphate ions in a range of 100ppm to 1500ppm for 30minutes. 168
Fig. 6-9. Concentrations of phosphate and ammonium ions remaining in the solution after reaction of bulk glass with different contents of P₂O5(이미지참조) in a range of 0 to 7mole% for 12hours. 170
Fig. 6-10. SEM images of glass surface with various contents of P₂O5(이미지참조) reacted with reaction solution containing only ammonium ions. 172
Fig. 6-11. Thin film XRD patterns of glass with various contents of P₂O5(이미지참조) reacted with reaction solution containing only ammonium ions. 173
Fig. 6-12. Concentrations of remained phosphate and removed ammonium ions with various initial ammonium ions of solution after reaction with 1g of 7P glass powder for 30minutes. 174
Fig. 6-13. Concentration of phosphate and ammonium ions remaining in a solution with 1g of 0P glass powder with various initial pH. 176
Fig. 6-14. Concentration of phosphate and ammonium ions remaining in a solution with 1g of 7P glass powder with various initial pH. 177
Fig. 6-15. Concentration of phosphate and ammonium ions remaining in a solution with 1g of 7P glass powder with various reaction time. 179
| 등록번호 | 청구기호 | 권별정보 | 자료실 | 이용여부 |
|---|---|---|---|---|
| T000030789 | 전자형태로만 열람가능함 | 이용불가 |
*표시는 필수 입력사항입니다.
| 전화번호 |
|---|
| 기사명 | 저자명 | 페이지 | 원문 | 기사목차 |
|---|
| 번호 | 발행일자 | 권호명 | 제본정보 | 자료실 | 원문 | 신청 페이지 |
|---|
도서위치안내: / 서가번호:

우편복사 목록담기를 완료하였습니다.
*표시는 필수 입력사항입니다.
저장 되었습니다.
