


권호기사보기
| 기사명 | 저자명 | 페이지 | 원문 | 기사목차 |
|---|
| 대표형(전거형, Authority) | 생물정보 | 이형(異形, Variant) | 소속 | 직위 | 직업 | 활동분야 | 주기 | 서지 | |
|---|---|---|---|---|---|---|---|---|---|
| 연구/단체명을 입력해주세요. | |||||||||
|
|
|
|
|
|
* 주제를 선택하시면 검색 상세로 이동합니다.
표제지
제출문
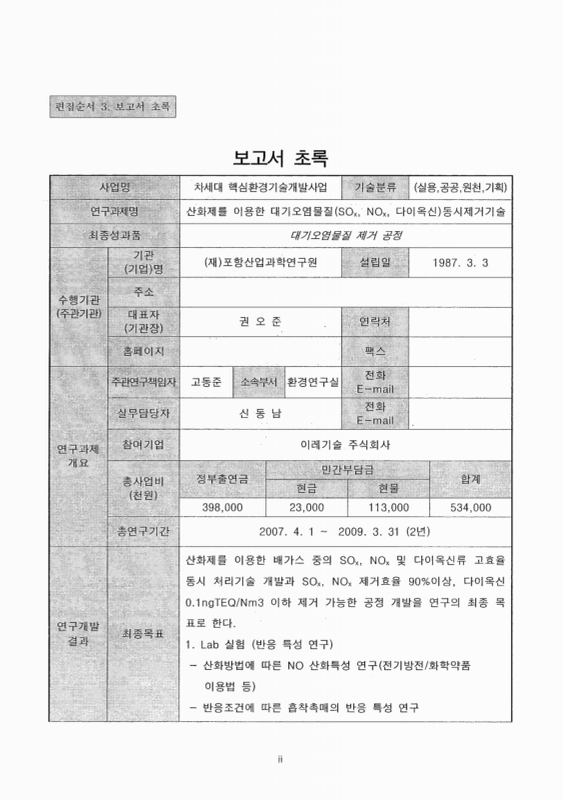
보고서 초록[개인신상정보 삭제]
목차
제1장 서론 13
가. 연구 개발의 중요성 및 필요성 13
1. 연구개발 필요성 및 기술개발 현황 13
2. 기술의 특성 15
나. 연구개발의 국내·외 현황 19
1. 세계적 수준 19
2. 국내수준 19
3. 국내·외의 연구현황 19
다. 연구 개발 기술의 차별성 20
제2장 연구계획의 목표 및 내용 21
가. 연구의 최종목표 21
나. 연도별 연구개발의 목표 및 평가방법 22
다. 연도별 추진체계 23
1. 연구개발의 추진 전략 23
2. 1차 년도 추진체계 23
3. 2차년도 추진체계 23
제3장 연구개발 수행 내용 및 결과 25
가. 연구개발 결과 및 토의 25
1. 산화 방법에 따른 NO 산화 특성 연구 25
2. 흡착 촉매제를 이용한 SOx 및 NOx 제거 실험(이미지참조) 60
3. NaClO₂에 의한 원소수은의 산화특성 70
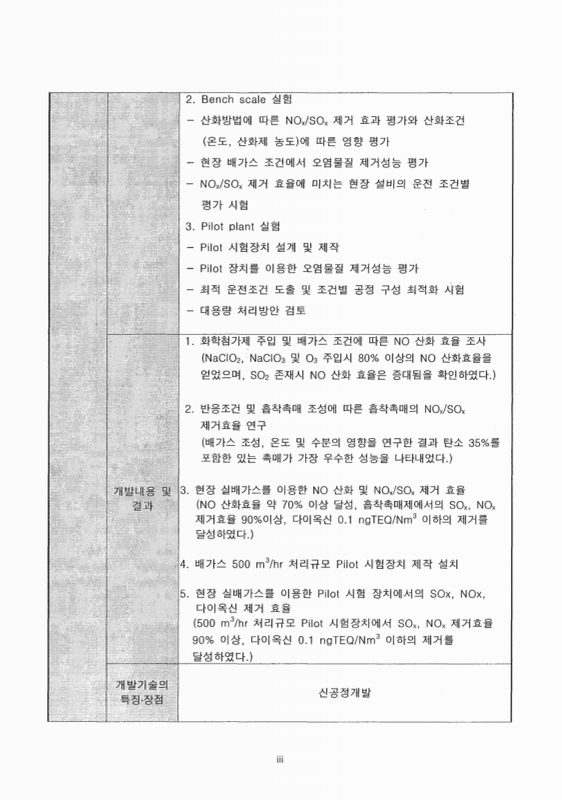
4. Bench scale 장치를 이용한 현장시험 82
5. Pilot scale 장치를 이용한 현장시험 87
나. 연구개발 결과 요약 94
다. 연도별 연구개발 목표의 달성도 95
라. 연구성과 96
1. 학술지 논문 96
2. 국내외 학술회의 발표 96
3. 특허출원 97
마. 관련분야 기술발전 기여도 97
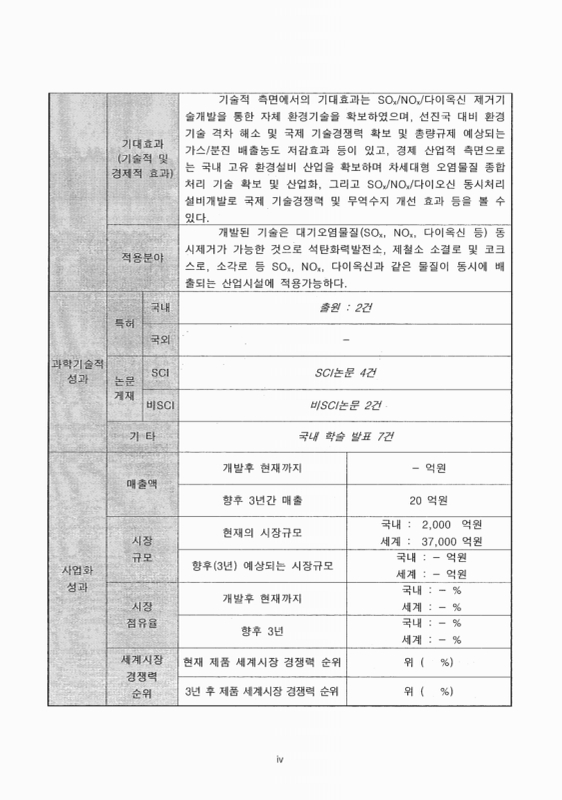
1. 기술적 측면 97
2. 경제 산업적 측면 97
바. 연구개발 결과의 활용계획 97
제4장 참고문헌 99
Fig 1-1. DeNOx(이미지참조) processes according to temperature 14
Fig 1-2. Comparison of DeNOx(이미지참조) between activated carbon and adsorption catalyst as a function of elapsed time 16
Fig 1-3. Comparison of NO removal with NO₂ removal on adsorption catalyst. 17
Fig 1-4. Hybrid system using Carbon Based Adsorption Catalyst. 18
Fig 3-1. Schematic diagram of NO oxidation experimental setup using chemical additive (NaClO₂) 26
Fig 3-2. Photograph of NO oxidation and NOx(이미지참조) removal experimental setup using chemical additive and carbon based catalyst. 27
Fig 3-3. Schematic diagram of NO oxidation experimental setup using ozone generated by DBD. 28
Fig 3-4. NO, NO₂ and NOx(이미지참조) concentration as a function of elapsed time after reaction of NO with NaClO₂(2.4 g). 29
Fig 3-5. Outlet NO, NO₂ end NOx(이미지참조) percentage with NO 200 ppm injection as a function of space velocity. 30
Fig 3-6. XRD spectra of NaClO₂ obtained before and after reaction of NO With NaClO₂. 30
Fig 3-7. Outlet NO, NO₂ and NOx(이미지참조) percentage with NO and NO₂ 200 ppm injection as a function of temperature 31
Fig 3-8. Weight and heat variation of NaClO₂ using TGA. 32
Fig 3-9. Temperature effect on the thermal decomposition of NaClO₂. 33
Fig 3-10. Added NO effect on the generation of NaClO₃(s) and NaCl(s). 34
Fig 3-11. Outlet NO, NO₂ and NOx(이미지참조) percentage with NO and NO₂ 200 ppm injection at NaClO₃ as a function of temperature 35
Fig 3-12. FTIR spectra obtained at reaction of NOx(이미지참조) with NaClO₂(a) reaction of NO (b) reaction of NO₂ 36
Fig 3-13. FTIR spectra obtained at reaction of NO₂ with NaClO₂. 37
Fig 3-14. Reaction between OClO and NO (a) NO, NO₂ and NOx concentration (b) FTTR spectra obtained at each position. 39
Fig 3-15. Comparison of experiment and simulation data with variation of OClO concentration as a function of added NO. 40
Fig 3-16. Comparison of experiment and simulation data as a function of added NO within 3.6 L/min at mixer. 41
Fig 3-17. Comparison of experiment and simulation data of OClO, ClON0₂, ClNO and ClNO₂ as a function of (a) elapsed time of experiment and (b) added NO of simulation. 42
Fig 3-18. Total mechanisms of NO oxidation and NOx removal at NaClO₂. 43
Fig 3-19. (a) Concentration of NO, NO₂ and SO₂ at the injection of SO₂ at reaction of NO with NaClO₂ and (b) FTIR specta at each position. 44
Fig 3-20. Concentration of NO₂ and SO₂ at reaction of SO₂ with OClO generated by reaction of NO₂ with NaClO₂. 45
Fig 3-21. Concentration of NO, NO₂ and SO₂ at reaction between NO and OClO generated by reaction of NO₂ with NaClO₂. SO₂ was added with NO after the reactor containing 2.4 gram NaClO₂. 45
Fig 3-22. FTIR spectra with elapsed time as a function of wavenumber at reaction of SO₂with NaClO₂. 46
Fig 3-23. XRD spectra obtained after the reaction of SO₂ with NaClO₂(s). 47
Fig 3-24. Color change of ortho-tolidine solution from. transparent to yellow by Cl₂ originated from the reaction of SO₂ with NaClO₂(s). 47
Fig 3-25. Concentration of NO, NO₂ and SO₂ at reaction of NO and SO₂ with NaCl. 48
Fig 3-26. Concentration of NO, NO₂ and SO₂ at reaction of NO and SO₂ with NaClO₃. 49
Fig 3-27. Concentration SO₂ as a function of elapsed time according to the presence and absence of H₂O. 50
Fig 3-28. Removal efficiency of SO₂ at the reaction of SO₂ with NaClO₂ at the presence and absence of NO as a function of weight of NaClO₂. 50
Fig 3-29. Outlet NO, NO₂ and NOx percentage with NO 200 ppm injection at NaClO₂ as a function of (a) O₂ concentration and (b) H₂O concentration. 51
Fig 3-30. Outlet concentration of NO and NO₂ as a function of elapsed time. 52
Fig 3-31. Outlet concentration of NO, NO₂ and NOx with temperature. 53
Fig 3-32. Outlet NO₂ Percentage redrawn of Fig. 3-31. 53
Fig 3-33. Outlet NO, NO₂ and NOx concentration as a function of elapsed time according to the increase of SO₂ concentration from 0 to 600 ppm. 54
Fig 3-34. FTIR spectra obtained at each SO₂ additlon. 54
Fig 3-35. (a) Profies of voltage and charge (b) Lissajous diagramp 56
Fig 3-36. Concentration of O₃ as a function of SED. 57
Fig 3-37. Concentration of O₃ according to O₂ concentration as a function of SED. 58
Fig 3-38. Concentration of (a) NO and NO₂ with injection of O₃ and (b) O₃ slip after reaction of O₃ with NO. 59
Fig 3-39. FTIR spectra obtained at reaction of 600 ppm O₃ with 200 ppm NO according to temperature. 59
Fig 3-40. Schematic diagram of NO removal experimental system using carbon based absorption catalyst. 60
Fig 3-41. Schematic diagram of NO oxidation using ozone and NO removal experiment using carbon based absorption catalyst systems. 61
Fig 3-42. Photograph of carbon based absorption catalyst according to the carbon contents. 61
Fig 3-43. Initial NOx(이미지참조) concentration as a function of elapsed time at the injection of (a) NO nd (b) NO₂. 63
Fig 3-44. NOx removal efficiency as a function of carbon contents with ratio of NO₂ to NOx.(이미지참조) 63
Fig 3-45. NOx removal with the ratio of NH₃ to inlet NOx.(이미지참조) 65
Fig 3-46. NOx removal efficiency as a function of ratio of inlet SO₂ to inlet NOx.(이미지참조) 65
Fig 3-47. SEM pictures and EDS spectra of carbon 35% absorption catalyst (a) fresh catalyst (b) reacted catalyst. 66
Fig 3-48. NOx(이미지참조) removal efficiency as a function of humidity. 66
Fig 3-49. NOx removal efficiency as a function of temperature with ratio of NO₂ to NOx.(이미지참조) 67
Fig 3-50. NOx removal efficiency as a function of temperature with ratio of NO₂ to NOx.(이미지참조) 68
Fig 3-51. Comparison of NOx(이미지참조) removal efficiency between C35 catalyst and carbon catalyst as a function of temperature. 69
Fig 3-52. Comparison of NOx(이미지참조) removal efficiency between C35 catalyst as a function of added O₃; O₃ was added to the gases for NO oxidation to NO₂. 70
Fig 3-53. Schematic diagram of Hg0(이미지참조) oxidation experimental setup using chemical additive (NaClO₂). 72
Fig 3-54. Photograph of NO oxidation and NOx(이미지참조) removal experimental setup using chemical additive and carbon based catalyst. PID : Propotional Integrate Derivation. 72
Fig 3-55. Temporal profiles of NO, NO₂ and Hg0 concentration. At first, N₂ and Hg were injected to the forward and backward position of the reactor containing NaClO₂(s), respectively....(이미지참조) 73
Fig 3-56. Oxidation efficiency of Hg0(이미지참조) as a function of added NO concentration. NO₂ in N₂ balance was injected to the forward position of the reactor containing NaClO₂(s).NO in N₂ balance was added to the backward position of that with varying the concentration.... 74
Fig 3-57. Profiles of OClO, Cl0N0₂, ClNO and ClN0₂ concentration as a function of added NO concentration. 75
Fig 3-58. Oxidation efficiency of HgO(이미지참조) as a function of added NO concentration. NO₂ in N₂ balance was injected to the forward position of the reactor containing NaClO₂(s).NO in N₂ balance was added to the backward position of that with varying the concentration.... 76
Fig 3-59. Temporal profiles of ClO, Cl and Cl₂ obtained by kinetics simulation as a function of elapsed time and input NO concentration. 77
Fig 3-60. Profiles of Hg0 concentrations obtained by kinetics simulation as a function of added NO concentration with addition of the reaction (a) between Cl and Hg0, (b) between ClO and Hg0.(이미지참조) 78
Fig 3-61. Oxidation efficiency of Hg0 as a function of added NO concentration. Two stages mixer was installed. At first mixer, the reaction of OClO with NO was occurred and at second mixer the reaction of Cl₂ with Hg0 was occurred....(이미지참조) 79
Fig 3-62. Oxidation efficiency of Hg0 as a function of added NO concentration. Hg0 was injected at the forward and backward position of reactor. 260 ㎛/N㎥ Hg0 was injected. Experimental conditions : Weight of packing NaClO₂(s) = 1.2 g, Total flow rate entering to...(이미지참조) 80
Fig 3-63. Oxidation efficiency of Hg0(이미지참조) as a function of added NO concentration. Experimental conditions : Weight of packing NaClO₂(s) = 1.2 g, Total flow rate entering to the FTTR = 3.6 L/min, temperature = 130℃ 81
Fig 3-64. Schematic diagram of bench scale experimental system. 83
Fig 3-65. Photograph of bench scale experimental system. 83
Fig 3-66. NO oxidation by NaClO₂ in the bench scale experimental system. 84
Fig 3-67. NO oxidation efficiency with the injection amounts of NaClO₂ in the bench scale experimental system. 85
Fig 3-68. NO oxidation by ozone in the bench scale experimental system. 86
Fig 3-69. SOx and NOx removal efficiency by carbon based adsorption catalyst.(이미지참조) 87
Fig 3-70. Photograph of Pilot scale expenmental system. 88
Fig 3-71. NO oxidation efficiency with the injection amounts of NaClO₂ in the Pilot scale experimental system. 89
Fig 3-72. SOx and NOx removal efficiency by carbon based adsorption catalyst.(이미지참조) 90
Fig 3-73. Effects of the space velocity on SOx and NOx removal efficiency by carbon based adsorption catalyst.(이미지참조) 91
Fig 3-74. Distribution of PCDD/PCDFs in the inlet of the system. 92
Fig 3-75. Distribution of PCDD/PCCDFS in the outlet of the system. 92
| 등록번호 | 청구기호 | 권별정보 | 자료실 | 이용여부 |
|---|---|---|---|---|
| T000030804 | 전자형태로만 열람가능함 | 전자자료 | 이용불가 |
*표시는 필수 입력사항입니다.
| 전화번호 |
|---|
| 기사명 | 저자명 | 페이지 | 원문 | 기사목차 |
|---|
| 번호 | 발행일자 | 권호명 | 제본정보 | 자료실 | 원문 | 신청 페이지 |
|---|
도서위치안내: / 서가번호:

우편복사 목록담기를 완료하였습니다.
*표시는 필수 입력사항입니다.
저장 되었습니다.
