


권호기사보기
| 기사명 | 저자명 | 페이지 | 원문 | 기사목차 |
|---|
| 대표형(전거형, Authority) | 생물정보 | 이형(異形, Variant) | 소속 | 직위 | 직업 | 활동분야 | 주기 | 서지 | |
|---|---|---|---|---|---|---|---|---|---|
| 연구/단체명을 입력해주세요. | |||||||||
|
|
|
|
|
|
* 주제를 선택하시면 검색 상세로 이동합니다.
표제지
제출문
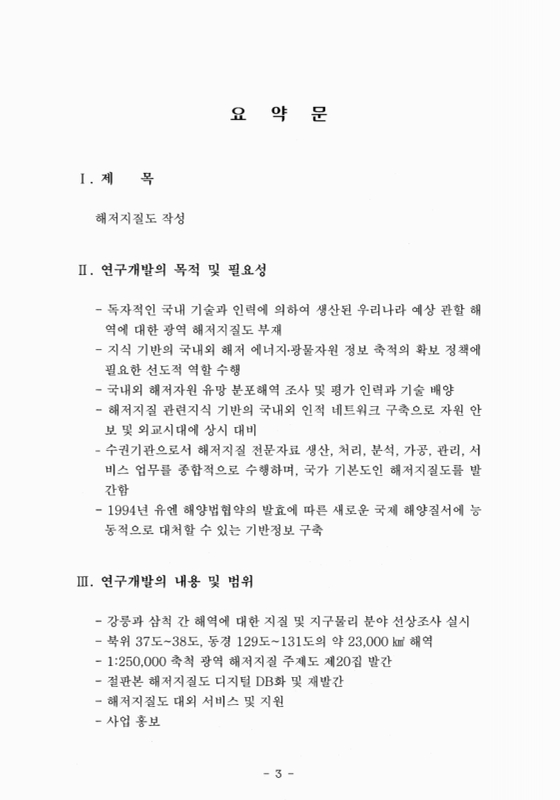
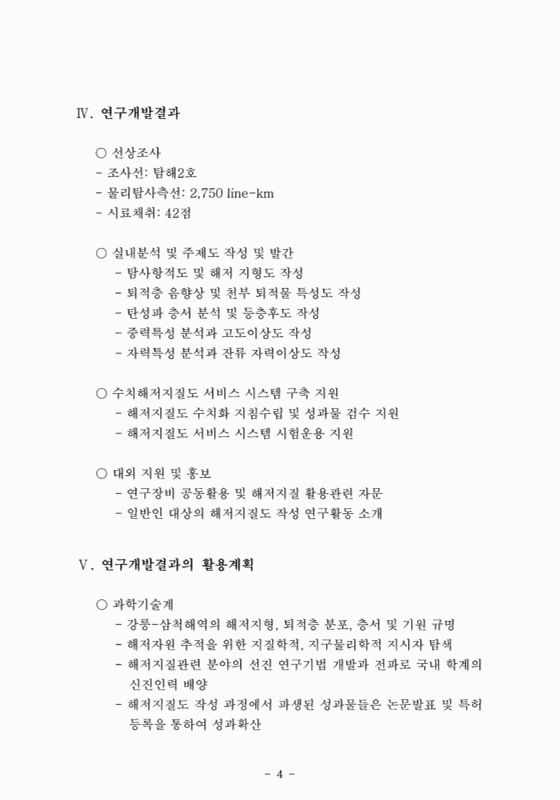
요약문
SUMMARY
CONTENTS
목차
제1장 서론 16
제2장 국내외 기술개발 현황 18
제1절 국내 기술개발 현황 18
제2절 해외 기술개발 현황 22
제3장 연구개발 수행내용 및 결과 26
제1절 연구지역 개괄 26
제2절 연구 방법 30
1. 선상자료 취득 30
2. 자료처리 및 분석 45
제3절 연구 결과 56
1. 수심 및 해저지형 56
2. 천부지층 퇴적상 및 물성 특성 57
3. 심부퇴적층 탄성파 층서 및 층후 77
4. 중력 특성 78
5. 자력 특성 78
제4절 결론 81
제4장 연구개발 목표 달성도 및 결과의 활용 계획 83
참고문헌 85
Fig. 1.1. Survey areas for marine geology mapping program as of 2009. 17
Fig. 2.1. Survey tracks around the Korean peninsular before 1983 (Chough, 2000). 18
Fig. 2.2. Survey tracks made by Korean agencies and cooperations between 1983 and 1999 (Chough, 2000). 19
Fig. 2.3. R/V Tamhae 2. 2000톤급 해저지질 및 지구물리 전용 탐사선으로서 1996년에 취역하였음. 19
Fig. 2.4. 한국지질자원연구원에서 제공하는 수치해저지질도 자료 현황 21
Fig. 2.5. 일본해양연구개발기구(JAMSTEC; Japan Agency for Marine-Earth Science and Technology)에서 개발하여 사용 중인 심해 무인잠수정. 22
Fig. 2.6. 미국 지질조사소가 가작한 Massachusetts 주 연안지역 해저지형 및 지질도 23
Fig. 2.7. 영국의 1:250,000 축척 연안 해저지질도 발간 현황. 24
Fig. 2.8. 일본의 해저지질도 발간 현황. 25
Fig. 3.1. 동해 및 주변해의 지리적, 지정학적 위치 (출처: Google Earth). 원들은 각각 동해와 연결된 해협으로서 밑에서부터 각각 대한해협.... 26
Fig. 3.2. 동해의 초기 열개 모델(Jolivet and Tamaki, 1992). 27
Fig. 3.3. 해저지질도 제20집 조사구역과 인근 지역의 국영문 해저지명(국립해양조사원, 2007). 굵은 선의 붉은색 사각형은 2009년도 조사구역. 28
Fig. 3.4. 조사지역 인근 육상의 지질 29
Fig. 3.5. 조사기간 중 항측자료 취득 및 모니터링을 위하여 사용된 탐해2호의 Trinav 항측 시스템(좌: Trinav GPS, 우: Trinav RT). 31
Fig. 3.6. 항측 기준점 (Ref. Point)과 각 사용 장비들의 이격거리를 보여주는 도면. 32
Fig. 3.7. 멀티빔 Sirmad EM12S 장비 모식도 34
Fig. 3.8. 멀티빔 자료처리 과정 36
Fig. 3.9. 조사지역 음속 수직 단면도 38
Fig. 3.10. Noise diagram shown by the TRIACQ system. 39
Fig. 3.11. G-880 해상 자력계 시스템의 예인용 센서. 42
Fig. 3.12. (a) Benthos Chirp II acoustic profiler system, (b) A piston corer used for this survey. 43
Fig. 3.13. Location of core samples (blue circles) acquired in the survey area during 2007 to 2009. Orange lines denote the tracks for chirp acoustic profiling. 43
Fig. 3.14. Gravimeter used for the survey (Microg LaCoste사). 45
Fig. 3.15. A picture of the multi-sensor core logger of KIGAM(Geotek MSCL-S) (above). Schematic diagram illustrating central sensor array of a MSCL (lower). Automated MSCL system... 51
Fig. 3.16. Digital image aquisition device attached to a XRF scanner. 52
Fig. 3.17. Spectrophotometer CM-2500d (left) and representation of color solid for L*a*b* color space (right). The numbers on each end of circles indicate ranges of L*a*b* values. 53
Fig. 3.18. Digital X-ray scanner and sample image. 53
Fig. 3.19. Microtrac사의 S3500 모델 레이저 회절 입도분석기의 모습(위)과 내부구조 및 측정원리(아래) 55
Fig. 3.20. 2007~2009년 동안 조사된 조사지역 (강릉-삼척 해역)의 수심 분포 56
Fig. 3.21. 조사지역 경사 단면도. 57
Fig. 3.22. Chirp profile and core locations along the line 09MAP 09-1. 58
Fig. 3.23. Photographs and X-radiographs of 09MAP-P01 core. 62
Fig. 3.24. Profiles of textural composition, mean size, sorting, water content, gamma ray attenuation (GRA) density, magnetic susceptibility, and p-wave velocity of core 09MAP-P01. 63
Fig. 3.25. Photographs and X-radiographs of 09MAP-P02 core. 64
Fig. 3.26. Profiles of textural composition, mean size, sorting, water content, gamma ray attenuation (GRA) density, magnetic susceptibility, and p-wave velocity of core 09MAP-P02. 65
Fig. 3.27. Photographs and X-radiographs of 09MAP-P03 core. 66
Fig. 3.28. Profiles of textural composition, mean size, sorting, water content, gamma ray attenuation (GRA) density, magnetic susceptibility, and p-wave velocity of core 09MAP-P03. 67
Fig. 3.29. Photographs and X-radiographs of 09MAP-P04 core. 68
Fig. 3.30. Profiles of textural composition, mean size, sorting, water content, gamma ray attenuation (GRA) density, magnetic susceptibility, and p-wave velocity of core 09MAP-P04. 69
Fig. 3.31. Photographs and X-radiographs of 09MAP-P05 core. 70
Fig. 3.32. Profiles of textural composition, mean size, sorting, water content, gamma ray attenuation (GRA) density, magnetic susceptibility, and p-wave velocity of core 09MAP-P05. 71
Fig. 3.33. Photographs and X-radiographs of 09MAP-P06 core. 72
Fig. 3.34. Profiles of textural composition, mean size, sorting, water content, gamma ray attenuation (GRA) density, magnetic susceptibility, and p-wave velocity of core 09MAP-P06. 73
Fig. 3.35. Photographs and X-radiographs of 09MAP-P08 core. 74
Fig. 3.36. Profiles of textural composition, mean size, sorting, water content, gamma ray attenuation (GRA) density, magnetic susceptibility, and p-wave velocity of core 09MAP-P08. 76
Fig. 3.37. Total isopach map of the northern part of the study area (Kwon et al., 2009). 77
Fig. 3.38. Gravity anomaly map of the mapped area including 2009 survey area in the upper left. The unit is mGal and the contour interval is 5 mGal. Note the relatively high value near the Ulleung Island and the central area. 79
Fig. 3.39. Magnetic anomaly map of the mapped area including 2009 survey area. The unit is nT. 80
Fig. 3.40. 3-dimensional diagram of the bathymetric distribution of the study area. View from northeast. 81
| 등록번호 | 청구기호 | 권별정보 | 자료실 | 이용여부 |
|---|---|---|---|---|
| T000032213 | 전자자료 | 이용불가 |
*표시는 필수 입력사항입니다.
| 전화번호 |
|---|
| 기사명 | 저자명 | 페이지 | 원문 | 기사목차 |
|---|
| 번호 | 발행일자 | 권호명 | 제본정보 | 자료실 | 원문 | 신청 페이지 |
|---|
도서위치안내: / 서가번호:

우편복사 목록담기를 완료하였습니다.
*표시는 필수 입력사항입니다.
저장 되었습니다.
