
 대표어
대표어


권호기사보기
| 기사명 | 저자명 | 페이지 | 원문 | 기사목차 |
|---|
결과 내 검색
동의어 포함
표제지
제출문
보고서 요약서
요약문
SUMMARY
CONTENTS
목차
제1장 연구개발과제의 개요 28
제1절 연구의 목적 28
제2절 연구의 필요성 29
1. 기술적 측면 29
2. 경제·산업적 측면 29
제2장 국내외 기술개발 현황 31
제1절 국내기술의 현황 31
1. 국내 기술 동향 31
2. 국내 기술 수준 32
제2절 선진국의 기술 현황 33
1. 선진국의 광물탄산화 기술 동향 33
2. 선진국의 광물탄산화 기술 34
제3장 연구개발수행 내용 및 결과 41
제1절 석고를 이용한 광물탄산화 41
1. 서론 41
2. 실험 및 분석법 43
3. 연구수행 결과 45
4. 설치 기자재 48
5. 시작품의 설계 51
6. 기대효과 51
제2절 황산암모늄 55
1. 서론 55
2. 실험 56
3. 결과 및 고찰 61
제3절 방해석 합성 83
1. 서론 83
2. 실험 86
3. 결과 89
4. 결론 103
제4절 방해석 흡착 105
1. 서론 105
2. 연구방법 107
3. 결과 및 고찰 108
4. 결론 121
제5절 슬래그를 이용한 광물탄산화 연구 122
1. 서언 122
2. 실험방법 123
3. 슬래그의 특성 126
4. 수열법에 의한 광물탄산화 127
5. 고기법에 의한 광물 탄산화 136
6. 결론 138
제6절 앰피볼, 사문석 146
1. 투각섬석을 이용한 광물 탄산화 146
2. 사문석을 이용한 광물 탄산화 163
제7절 참굴 패각재생과정을 이용한 생체모방공학적 이산화탄소 처리 기술 개발 178
1. 서론 178
2. 연구방법 179
3. 실험방법 182
4. 실험결과 186
5. 결론 192
제8절 저온성 시멘트 광물의 변질 특성 연구 194
1. 서론 194
2. 국내외 기술개발 현황 195
3. 실험 대상 물질 및 방법 196
4. 결과 및 토론 198
5. 결론 208
제9절 생지화학적 광물탄산염 광물생성연구 209
1. 서론 209
2. 국내외 기술개발 현황 210
3. 연구개발수행 내용 및 결과 211
4. 연구 결과 및 토의 218
5. 결론 234
6. 연구개발목표 달성도 및 대외기여도 235
7. 기대효과 236
제10절 실시간 X-선 회절법을 이용한 제올라이트-CO₂ 반응 연구-II 238
1. 서론 238
2. 연구 방법 239
3. 연구개발수행 내용 및 결과 244
제4장 목표달성도 및 관련분야에의 기여도 251
제1절 연도별 연구목표 251
제2절 연구개발목표의 달성도 252
제5장 연구개발결과의 활용계획 253
제1절 기술적 측면 253
제2절 경제·산업적 측면 253
제3절 정책적 측면 254
제4절 산업화 방안 254
1. 중장기 TRM 257
제6장 연구개발과정에서 수집한 해외과학기술정보 259
제7장 참고문헌 260
Fig. 2-1. Direct gas-solid reaction times achieved for complete carbonation (kinetic control) at various carbonation conditions of 74-125㎛ particles at TKK, Finland (Sipila et al., 2008). 37
Fig. 2-2. Schematic illustration of a CaCO₃ production process from waste cement (Katsuyama et al., 2005). 38
Fig. 3-1-1. Flow of the process for the gypsum carbonation. 44
Fig. 3-1-2. An air view for the gypsum carbonation. 52
Fig. 3-1-3. A side view 1 of bench plant for the gypsum carbonation. 53
Fig. 3-1-4. A side view 2 of bench plant for the gypsum carbonation. 54
Fig. 3-2-1. DTA/TGA profile of dried FGD-gypsum in the flow of ramped temperature. 62
Fig. 3-2-2. DTA/TGA profile of ammonium sulfate produced in the flow of ramped temperature. 65
Fig. 3-2-3. pH profile dependent on sample dried temperature 67
Fig. 3-2-4. Temperature profile dependent on sample dried temperature 67
Fig. 3-2-5. pH profile dependent on initial water temperature 68
Fig. 3-2-6. Temperature profile dependent on initial water temperature 69
Fig. 3-2-7. pH profile dependent on added ammonia amount 70
Fig. 3-2-8. Temperature profile dependent on initial water temperature 70
Fig. 3-2-9. DTA/TGA profile diagram of calcium carbonate obtained from the different gypsum dried temperature. 71
Fig. 3-2-10. DTA/TGA profile diagram of calcium carbonate in the condition of different water temperature. 72
Fig. 3-2-11. DTA/TGA profile diagram of calcium carbonate in condition of different amount of ammonia addition 73
Fig. 3-2-12. FC type crystallizer diagram. 75
Fig. 3-2-13. DTB type crystallizer diagram. 76
Fig. 3-2-14. OSLO type crystallizer diagram. 77
Fig. 3-3-1. SEM images of CaCO₃ prepared at 5.04 MPa (a), 7.43 MPa (b) and 12.02 MPa (c) in the presence of Tween 80. 84
Fig. 3-3-2. SEM images of CaCO₃ particles prepared at 7.43 MPa in the presence of SDS (a) and CTAB (b). 84
Fig. 3-3-3. SEM images of CaCO₃ prepared at 4.90 MPa (a), 7.43 MPa (b) and 12.04 MPa (c) in the absence of surfactant. 84
Fig. 3-3-4. Critical micelle concentrations of SDS in 0.5 M CaCl₂·2H₂O (a) and (b) 0.5 M Na₂CO₃. 87
Fig. 3-3-5. Transmittance of infrared spectra of synthesized calcium carbonate from combination of solutions according to Table 3-3-1. Calcite (712cm-1, 877cm-1 and 1430cm-1), vaterite (744cm-1) were coexisted and aragonite (1090cm-1) was present with...(이미지참조) 90
Fig. 3-3-6. X-ray diffraction patterns of calcium carbonate from combined solutions according to Table 3-3-1. Despite from the FT-IR results, X-ray diffraction patterns reveal that synthesized calcium carbonate did not include aragonite.... 91
Fig. 3-3-7. The relative development of orientations (hkl) of (a) calcite (b) vaterite by calculating equation (1). JCPDS 05-0586 and 25-0127 offered reference intensities of both polymorphs. 93
Fig. 3-3-8. FE-SEM images of synthesized calcium carbonate referred to Table 3-3-1. When concentration of SDS increases in carbonate source solution, calcite is clearly seen while tiny vaterited is disappeared.... 94
Fig. 3-3-9. The relative development of orientations (hkl) of (a) calcite (b) vaterite by calculating equation (1). JCPDS 05-0586 and 25-0127 offered reference intensities of both polymorphs. 96
Fig. 3-3-10. X-ray diffraction patterns of calcite crystallized by combination of each source solution shown in Table 3-3-2. 97
Fig. 3-3-11. FE-SEM images of calcite crystals precipitated by combinations shown in Table 1. 99
Fig. 3-3-12. SEM-EDS images of sulfur distribution on crystal precipitated from combined solution (d'+z'). Sulfur distribution profiled at a depth of 1 ㎛ from the surface. Net-like cracks were scars caused by high energy X-rays. 101
Fig. 3-3-13. Thermal weight loss in particles from (a'+w') (i.e., pure calcite), (d'+z'), and pure SDS. These profiles identify the particles from (d'+z') as mixtures of pure calcite and SDS.... 102
Fig. 3-3-14. SEM-EDS images of sulfur profiles for relatively large crystals precipitated from combined solutions (c+w) and (c+y). Intensive sulfur distribution associated with cracks caused by the X-rays was not clearly seen on these particles.... 103
Fig. 3-4-1. Comparison of particle size of FGD gypsum and produced waste calcium carbonate. 109
Fig. 3-4-2. The powder X-ray diffraction (XRD) pattern of calcite particles obtained from CO₂ capture using flue gas desulfurization (FGD) gypsum (B: bassanite; C: calcite; D: dolomite; M: muscovite). 109
Fig. 3-4-3. Uptake of Cd(II) (100 mg/L) by the adsorbent (10 g/L) as a function of time. 110
Fig. 3-4-4. Cd(II) adsorption by the adsorbent (10 g/L) as a function of the initial pH of the Cd(II) solution. 111
Fig. 3-4-5. Uptake of Cd(II) (100 mg/L) as a function of adsorbent dose (2.5-40 g/L). 112
Fig. 3-4-6. Linear fit of experimental data using (a) pseudo first-order kinetic model, (b) pseudo second-order kinetic model, and (c) intraparticle diffusion model for the adsorption of Cd(II) sorption. 114
Fig. 3-4-7. Effect of the initial concentation of Cd(II) (20-200 mg/L) on Cd(II) sorption by the adsorbent (10 g/L). 115
Fig. 3-4-8. Langmuir (a) and Freundlich (b) isotherms of Cd(II) sorption on the adsorbent (10 g/L) in the Cd(II) concentration range of 20-200 mg/L. 116
Fig. 3-4-9. Concentration of adsorbed cadmium and dissolved calcium as a function of time in a reaction of 0.89 mM CdCl₂ with calcite particles (10 g/L) in 10 mM NaCl aqueous solution. 117
Fig. 3-4-10. XPS survey spectra of calcite particles (a) as prepared; (b) reacted with 0.89 mM (100 mg/L) CdCl₂ aqueous solution during 24h. 118
Fig. 3-4-11. FE-SEM image of calcite particles (a) as prepared; (b) reacted with CdCl₂ aqueous solution during 24 h. 119
Fig. 3-4-12. XPS Cd3d spectra of sorption products as a function of time expressed in (a) measured counts; (b) arbitrary units. 120
Fig. 3-5-1. Hydrothermal unit for the mineral carbonation. 124
Fig. 3-5-2. Process of mineral carbonation from slags. 125
Fig. 3-5-3. Process of mineral carbonation by solid state method. 126
Fig. 3-5-4. XRD patterns of the products from mineral carbonation of blast furnace slag at 150℃ with sample weight and duration. 130
Fig. 3-5-5. XRD patterns of the products from mineral carbonation of blast furnace slag at 200℃ with sample weight and duration. 132
Fig. 3-5-6. XRD patterns of the products from mineral carbonation of blast furnace slag at 290℃ with sample weight and duration. 134
Fig. 3-5-7. XRD patterns of the products from mineral carbonation of reduced slag in (a) 150℃ , (b) 200℃ and (c) 290℃. 141
Fig. 3-5-8. Leaching values according to various acids. 143
Fig. 3-5-9. XRD patterns of the precipitated products from the solutions leached with (a) HNO₃, (b) HCl, and (c) CH₃COOH. 144
Fig. 3-5-10. XRD patterns of the product from mineral carbonation with acids. (a) HNO₃, (b) HCl, and (c) CH₃COOH. 145
Fig. 3-6-1. Top and side views of the amphibole structure. The top schematic looks down on the c-axis and the bottom diagram gives a side view of the structure along the... 149
Fig. 3-6-2. A simplified view of the tremolite structure from Fig. 3-6-1 and a schematic of OH- and Mg-bonding. 150
Fig. 3-6-3. The schematic diagram of hydrothermal apparatus. 151
Fig. 3-6-4. The procedure of the mineral carbonation. 151
Fig. 3-6-5. XRD patterns of starting material (a) and products after each of three reaction times: 5min (b), 15min (c), 5 hr (d). 153
Fig. 3-6-6. The variation of the amount of transformed calcite with reaction time. The data are obtained from qualitative analysis of diffraction patterns for each sample. 153
Fig. 3-6-7. Effect of ethylene-glycole treatment of d spacing (001) of synthetic saponite. 154
Fig. 3-6-8. SEM image of synthesized calcite obtained by reaction for various durations,(a) tremolite(trmeolite), (b) 5 min, (c) 15min, (d) 30min ,(e) 1 hour, (f) 5 hours. 156
Fig. 3-6-9. TEM image of tremolite obtained after reaction for various durations. Arrows indicate proto-saponite (a) 0 min. (b) 5 min. (c) 15 min. (d) 30 min. (e) 1 hour (f) 5 hour. 157
Fig. 3-6-10. TEM image of a euhedral calcite crystal surrounded by proto-saponite fibers. 159
Fig. 3-6-11. The results of FIB analysis and EDS data for the synthetic calcite. 160
Fig. 3-6-12. Spectrum of the tremolite and synthetic calcite after reaction for various durations. (a) tremolite (b) 5 min. (c) 15 min. (d) 5 hr. 162
Fig. 3-6-13. Structure of serpentine. 165
Fig. 3-6-14. XRD patterns of starting material. 165
Fig. 3-6-15. Schematic diagram of the carbonation reaction system. 1) Bomb of CO₂ 2) Flow meter, 3) pH meter 4) Thermocouple 5) Class Reactor body, 6) cover plate, 7) stirrer, 8) Temperature controller. 167
Fig. 3-6-16. XRD patterns of serpentine heated by various atmosphere. (N₂, CO₂, air) 168
Fig. 3-6-17. FT-IR patterns of raw and heat treated (by N₂, CO₂, air) serpentine. 169
Fig. 3-6-18. XRD patterns of heat treated mixture of serpentine and oxalic acid (500℃). 170
Fig. 3-6-19. FT-IR patterns of heat treated mixture of serpentine and oxalic acid (300℃). 171
Fig. 3-6-20. XRD patterns of reaction products prepared by heating the mixture of serpentine and oxalic acid at 200℃~600℃. 172
Fig. 3-6-21. SEM micrographs of reaction products prepared by heating the mixture of serpentine and oxalic acid at 200℃ and 500℃. 172
Fig. 3-6-22. TG-DTA graph of reaction product prepared by heating the mixture of serpentine and oxalic acid at 200℃. 173
Fig. 3-6-23. XRD patterns of carbonation product prepared at ambient condition. 174
Fig. 3-6-24. X-ray diffraction pattern of reaction products obtained by carbonation of the sample prepared by heating the mixture of serpentine and oxalic acid at 500℃. 175
Fig. 3-6-25. SEM micrograph of reaction products obtained by carbonation of the sample prepared by heating the mixture of serpentine and oxalic acid at 500℃. 176
Fig. 3-6-26. TG-DTA results of the carbonation product. 176
Fig. 3-7-1. The hydration of CO₂ catalyzed by hCA (human Carbonic Anhydrase II) proceeds through several chemical steps. 181
Fig. 3-7-2. (a) The photograph shows an inner surface of the left valve of an oyster shell (Crassostreagigas). The solid line shows the regenerated shell and the black staris the center of the regenerated shell.... 182
Fig. 3-7-3. Circular dichroism spectra of bovine carbonic anhydrase II (a) and BRSR (b) (k: 1000). The secondary protein structure was analysed. 187
Fig. 3-7-4. cDNA and amino acid sequence of BRSR. 188
Fig. 3-7-5. A sequence alignment of bovine carbonic anhydrase II from bovine and BRSR from regenerated shell. One-letter amino acid code used. Red Acidic residues D and E Magnta Basic residues R, H, and K.... 189
Fig. 3-7-6. Scanning Electron Microscope images of crystals synthesized by bovine carbonic anhydrase II (a~d) and hemocyte from regenerated shell (e~h). The calcium carbonate was synthesized according to a different reaction time (a and e: 3hr, b and f:... 191
Fig. 3-7-7. Biomimetic CO₂ sequestration system. 192
Fig. 3-8-1. 네 가지 용출제의 폐콘크리트, 포틀랜드 시멘트, 생석회의 Ca 용출 효율: NH₄Cl, CH₃COOH, HCl, Dlwater(?: Ca용출 효율이 알 수 없는 오류로 100%를 초과) 201
Fig. 3-8-2. CO₂주입 실험 중 pH, EC의 시간에 따른 변화. 각각 NH₄Cl를 사용한 (a)생석회, (b)포틀랜드 시멘트, (c)폐콘크리트, HCl 사용한 (d)생석회, (e)포틀랜드 시멘트, (f)폐콘크리트 203
Fig. 3-8-3. 초순수를 용출제로 사용한 Ca 용출 실험 후 각 시료의 현탁액과 상등액의 CO₂주입 실험 중 pH, EC의 시간적 변화. (a) 생석회의 상등액, (b)포틀랜트 시멘트의 상등액, (c) 폐콘크리트의 상등액, (d) 생석회의 현탁액, (e) 포틀랜드 시멘트의 현탁액, (f) 폐콘크리트의 현탁액 204
Fig. 3-8-4. CO₂주입 실험으로 생성된 백색 침전물의 XRD 결과. (a) 생석회, (b) 포틀랜드 시멘트(●: calcite, ▲ vaterite). 206
Fig. 3-8-5. 네 가지 용출제에 따른 폐콘크리트, 포틀랜드 시멘트, 생석회의 이산화탄소 탄산염화 효율. 이산화탄소 탄산염화 효율은 물질 내 1g의 CaO당 CaCO₃의 형태로 침전된 CO₂의 양을 나타낸다. 207
Fig. 3-9-1. Experimental set-ups showing anoxic conditions of the AMD and Precipitates within 2-L serum bottles. 213
Fig. 3-9-2. Anaerobic chamber [Coy laboratory products] used for keeping anoxic conditions of the samples 213
Fig. 3-9-3. XRD patterns of precipitate samples, A5, D6, B7 and C5 219
Fig. 3-9-4. SEM-EDX analysis (a) and TEM-EDX/DP analysis (b) of schwertmannite, pin-cushion shape and size of 200-300 nm in precipitates. 219
Fig. 3-9-5. Photograph showing color changes of precipitates under anoxic conditions, reddish brown precipitates are changed to black precipitates within day 13 221
Fig. 3-9-6. XRD patterns of precipitates at 3 days intervals under anoxic conditions 222
Fig. 3-9-7. SEM image of siderite agglomerate (a) and a regular hexahedron siderite (b), TEM-EDX, DP analysis of siderite agglomerate (c). 223
Fig. 3-9-8. Variation of Fe2+ concentrations during the bioreduction of AMD and precipitates under anoxic conditions(이미지참조) 227
Fig. 3-9-9. SEM image of twist stalk Gallionella sp. (a) and a magnification(?0) view of surface of a Gallionella sp. and EDX analysis (b) 230
Fig. 3-9-10. DGGE patterns (left) and phylogenetic tree (right) from AMD at Jeonjuil mine (analyzed samples; E0, D5, D3, C5, C4, C2) 231
Fig. 3-9-11. DGGE patterns (left) and phylogenetic tree (right) showing the changes of microbial diversity of AMD under the anoxic conditions (analyzed samples; Jeon-1, Jeon-2, Jeon-3) 232
Fig. 3-10-1. Merrill-Bassett 타입 다이아몬드 앤빌셀(연세대학교 결정학연구실) 239
Fig. 3-10-2. (왼쪽) - 다이아몬드 앤빌셀 내의 시료 압력을 측정하기 위한 레이저-루비 플루오레슨스 압력측정 시스템: 포항가속기연구소에 설치, (오른쪽) - 다이아몬드 앤빌셀을 이용한 고압 회절 데이터 측정 시스템: 포항가속기의 wiggler 선원과... 240
Fig. 3-10-3. 기스몬딘 제올라이트의 골격구조를 c-축 방향에서 바라본 그림. 네 개의 사면체로 구성된 단위가 크랭크 쉐프트(crank-shaft) 방식의 체인을 이루며 a-축과 c-축 방향으로 배열되어 있다.... 241
Fig. 3-10-4. 물을 매개체로 사용한 기스몬딘 제올라이트의 압력에 따른 회절패턴의 변화. 공간군 I2/a에 의하여 확인된 Bragg 회절선들의 압력에 따른 이동이 서로 다른 크기로 관찰된다. 241
Fig. 3-10-5. 자연산 나트로라이트 결정(from San Juan, Argentina). 철 분순물의 함유로 인해 갈색을 띰(연세대학교 결정학연구실) 243
Fig. 3-10-6. 나트로라이트에서 일어나는 압력에 따른 격자 부피와 결정수 양의 변화(22) 243
Fig. 3-10-7. 기스몬딘에서 일어나는 압력에 따른 단위포 부피의 상대적 변화(조성이 다른 기스몬딘과 비교한 그림) 245
Fig. 3-10-8. 기스몬딘에서 일어나는 압력에 따른 단위포 격자상수값의 변화 246
Fig. 3-10-9. 기스몬딘에서 체인의 압력에 따른 선형도 변화 246
Fig. 3-10-10. 이산화탄소를 매개체로 사용한 나트로라이트 제올라이트의 압력에 따른 회절패턴의 변화. 247
Fig. 3-10-11. a,b. 나트로라이트에서 일어나는 CO₂ 압력에 따른 (a-b) 단위포 248
Fig. 3-10-11. c. 나이트로라이트에서 일어나 CO₂압력에 따른 체적 값의 변화 249
Fig. 3-10-12. 1.5 GPa-100 C에서 이산화탄소의 흡착이 일어난 나트로라이트의 구조모델. 흡착된 CO₂는 ab-평면상에 약 13도의 각도로 위치하며 기존에 흡착되어 잇는 물분자의 위치를 체널의 한쪽 면으로 이동시킨 것으로 확인된다. 249
Fig. 3-10-13. 이산화탄소를 매개체로 사용한 나트로라이트 제올라이트의 압력에 따른 라만 산란 패턴의 변화. 250
I. 제목
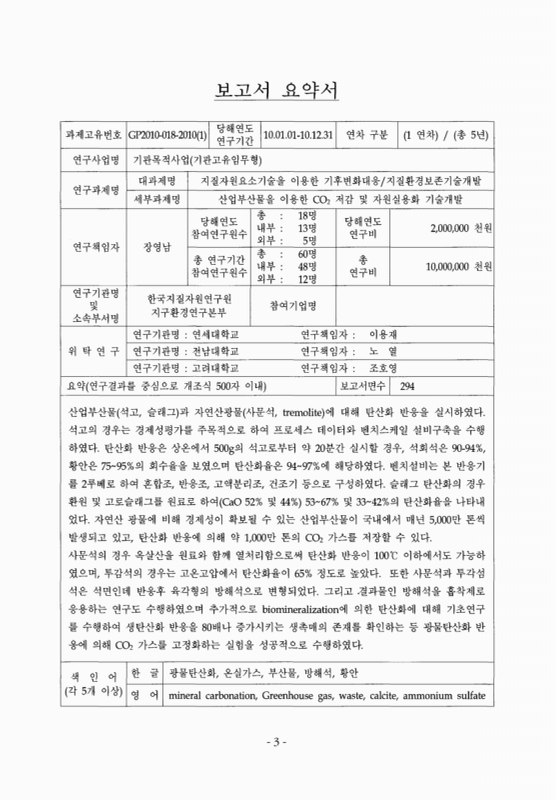
산업부산물을 이용한 CO₂ 저감 및 자원실용화 기술개발
II. 연구개발의 목적 및 필요성
○ 2005년 2월 온실가스 감축의무를 부과한 교토의정서가 발효됨으로써 향후 온실가스 배출에 따른 범세계적 규제가 강화될 예정임.
○ 한국의 CO₂ 배출량은 세계 10위로 약 6억톤이며 배출량 증가율은 세계 1위임.
○ 현재 CCS 연구가 활발히 진행 중에 있으나, 지중저장은 장기계획이며 저장시설 확보가 쉽지 않은 반면, 광물탄산화법에 의한 CO₂ 저장법은 비교적 단기간에 실용화 할 수 있음.
○ 포집된 CO₂ 가스를 광물의 결정구조 내에 고정화 시키는 방법은 지중처분에 비해 확실하고 안정적인 저장방법이며 추가적 모니터링이 불필요함.
○ 국내에서 발생되는 산업부산물(석고, 콘크리트, 슬래그)은 년간 4,500만톤씩 발생되고 있으며 이들을 탄산화 처리하면 년간 1,200만톤의 CO₂를 저감시킬 수 있음.
○ 광물탄산화법은 부산물을 원료로 이용하므로 환경보호와 동시에 자원 재활용 효과가 크고 또한 부수적으로 발생되는 방해석은 고급 석회석 대체품으로 활용.
III. 연구개발의 내용 및 범위
○ 광물탄산화 반응을 위한 원료물질의 확보
○ 문헌조사
○ 원료물질 전처리 기술 확립
(원료별 CaO 함량 : 부산석고 40%, 슬래그 60%), 순도 : 95% 이상, 입도 : 325매쉬 이하)
○ 산업부산물(석고, 슬래그 등) 및 자연산 광물(앰피볼, 사문석 등)대한 CO₂ 고정화 특성 연구
○ 광물 탄산화 기초실험
○ 4개 부산물의 이론적 CO₂ 고정화율 대비 80% 이상의 고정화 기술 제시
○ 광물탄산화를 위한 적정 광물군에 대한 광물학적, 물리화학적 특성 연구
○ 슬래그의 침출특성 평가 및 탄산화 반응
○ 슬래그의 CO₂ 흡수능 평가 및 반응기구 규명
○ 탄산화를 위한 새로운 원료탐색
○ Tremolite 및 규회석에 대한 광물학적 특성조사연구
○ Tremolite 및 규회석에 대한 CO₂ 고정화 기초연구
○ 산업부산물 및 자연산 광물에 대한 분쇄, 분리정제 기술개발
○ 방해석 및 황안 제품의 상품성 및 용도개발
○ CO₂ 고정화 벤치 플랜트 설비 설계 및 구축
○ Carbon budget 및 경제성 검토
○ Electro dialysis를 이용한 폐석고 및 ammonium sulfate 용액 정제화 기술 확립
○ 반응산물의 용도별 품질특성 조사/분석
○ 방해석의 재활용 연구(중금속 흡착제)
○ 방해석 및 베터라이트의 선택적 합성기술개발
○ Biomineralizaion 및 생촉매 연구
IV. 연구개발결과
○ 석고(배연탈황 및 인산), 콘크리트, 슬래그, 앤피볼, 사문석 등의 원료광물을 이용한 광물탄산화 반응 기술을 확보하였음.
○ 석고의 광물탄산화 반응 실용화를 위한 프로세스 데이터를 확보
○ 벤치플랜트 구축(1000톤/년 처리설비)
○ 탄산화 원료물질에 대한 광물학적 특성연구
○ 광물탄산화 반응 매카니즘 규명
○ 원료물질별 CO₂ 고정화 실험 및 광물탄산화 최적조건 확보
○ 입방형, 방추형 등 방해석 결정형태제어법 개발
○ 생성된 방해석의 입도제어법 개발(3마이크론 이하)
○ 방해석의 동질 이상(calcite, vaterite, aragonite)에 대한 지화학적연구
○ 탄산화 반응비용 최소화방안 강구
○ 부산물인 CaCO₃에 대한 고순도화 및 재활용 연구
○ 석고의 광물탄산화 반응 실용화를 위한 기술을 확립
○ 생촉매 존재확인
V. 연구개발결과의 활용계획
○ 산업부산물로부터 1,200만 톤/년 CO₂ 톤을 처리하여 약 5,000억 원에 해당되는 배출권을 확보할 수 있음.
○ 온실가스 고정화기술 개발은 온실가스 의무감축량을 충당하는 효과적인 대안이 될 것이고, 나아가 CDM 사업을 통한 온실가스 배출권의 추가확보.
○ 1,200만 톤/년 CO₂ 톤을 처리하면 약 1,500만 톤/년의 방해석이 부산물로써 만들어지는데 이것으로 국내 자연산 석회석 시장을 대체할 수 있으므로 석회석자원 및 자연보호 효과 큼.
○ 벤치 스케일 광물탄산화 공정개발 및 경제성 검토 후, 부산물 발생업체(비료회사 등)에 적용하여 플랜트 건설 추진(in-situ plant).
○ 화력발전소 및 제철공장에 적용하여 녹색발전소화 추진.
○ 석회석 대체용 방해석 분말생산법의 산업화추진| 등록번호 | 청구기호 | 권별정보 | 자료실 | 이용여부 |
|---|---|---|---|---|
| T000034740 | 전자형태로만 열람 가능함 | 전자자료 | 이용불가 |
*표시는 필수 입력사항입니다.
| 전화번호 |
|---|
| 기사명 | 저자명 | 페이지 | 원문 | 기사목차 |
|---|
| 번호 | 발행일자 | 권호명 | 제본정보 | 자료실 | 원문 | 신청 페이지 |
|---|
도서위치안내: / 서가번호:

우편복사 목록담기를 완료하였습니다.
*표시는 필수 입력사항입니다.
저장 되었습니다.
