권호기사보기
| 기사명 | 저자명 | 페이지 | 원문 | 기사목차 |
|---|
| 대표형(전거형, Authority) | 생물정보 | 이형(異形, Variant) | 소속 | 직위 | 직업 | 활동분야 | 주기 | 서지 | |
|---|---|---|---|---|---|---|---|---|---|
| 연구/단체명을 입력해주세요. | |||||||||
|
|
|
|
|
|
* 주제를 선택하시면 검색 상세로 이동합니다.
표제지
제출문
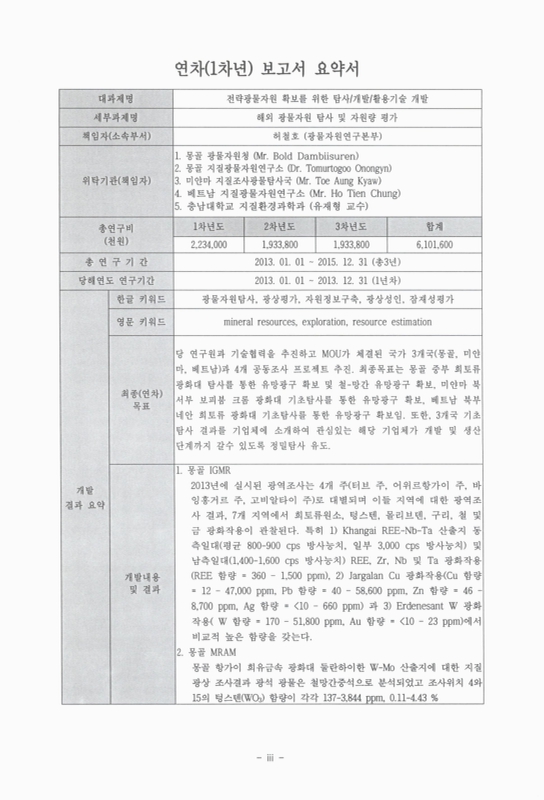
연차(1차년) 보고서 요약서
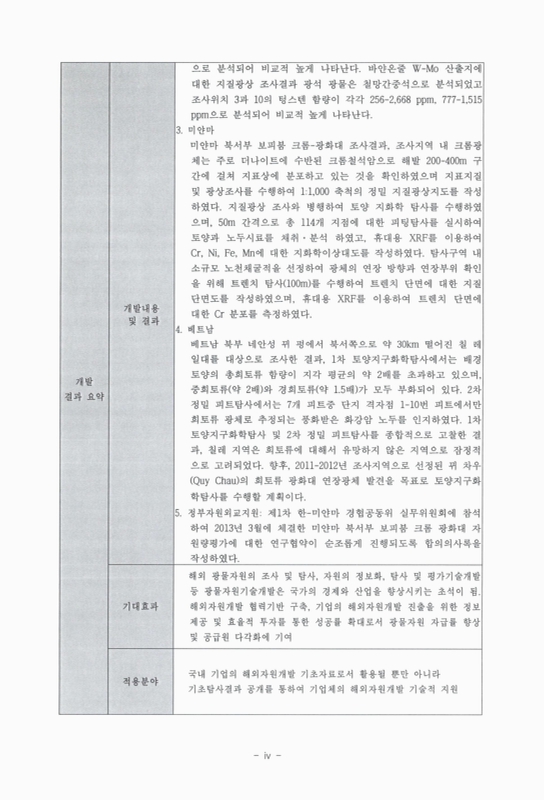
요약문
SUMMARY
Contents
목차
제1장 연구개발과제의 개요 35
제2장 국내·외 기술개발현황 37
제3장 연구개발 수행 내용 및 결과 45
제1절 서론 45
제2절 몽골 서부 희토류 광화대 조사결과 47
제3철 몽골 항가이 지역 텅스텐-몰리브덴 광화대 조사결과 119
제4절 베트남 네안성 희토류 광화대 조사결과 177
제5절 미얀마 보피붐 지역 크롬 광화대 조사결과 246
제6절 위탁연구결과 325
1) 위탁과제 1(몽골 IGMR) 325
2) 위탁과제 2(몽골 MRAM) 364
3) 위탁과제 3(베트남 VIGMR) 445
4) 위탁과제 4(미얀마 DGSE) 518
5) 위탁과제 5(충남대학교) 710
제7절 광물자원 포털사이트 운영 780
제8절 정부자원외교지원 798
제9절 결론 800
제4장 참고문헌 803
Fig. 1-1. Distribution of world non-ferrous mineral exploration budgets(excluding... 40
Fig. 1-2. Exploration expenditure of Canada from 1997 to 2008(Canadian... 41
Fig. 1-3. Exploration and deposit appraisal expenditures by type of activity, 2007... 41
Fig. 1-4. Exploration and deposit appraisal expenditures in Canada, by commodity... 42
Fig. 1-5. Expenditures on exploration and deposit appraisal by province, 2008-09... 42
Fig. 1-6. Exploration expenditures of Labrador and Newfoundland. Canada 1982-2009... 43
Fig. 1-7. Situation of diamond drilling, Labrador and Newfoundland, Canada from 1982... 43
Fig. 1-8. Australian mineral exploration expenditure. excluding gold and base metals,... 44
Fig. 2-1. Modal quartz (Q)-alkali feldspar (A)-plagioclase (P) ternary plot. IAG=island arc... 49
Fig. 2-2. Minerals from the Khangai area 49
Fig. 2-3. Zircons from the Khangai area 52
Fig. 2-4. Area mapping of zircon from the Khangai area 52
Fig. 2-5. Line mapping of zircon from the Khangai area. 53
Fig. 2-6. Mutual discussion for IGMR's reform and data of research area between... 55
Fig. 2-7. Regional location of study area(left=first study area, right=second... 56
Fig. 2-8. Geological map of the Erdenesant area 57
Fig. 2-9. The contact between biotite granite (front) and sedimentary rock (back)... 58
Fig. 2-10. Biotite granite (left) and miarolitic structure(right=pegmatite... 58
Fig. 2-11. Massive barren quartz vein (left) and black minerals-bearing quartz... 59
Fig. 2-12. W-bearing greisen vein from the Erdenesant area(valley, 2 site) 60
Fig. 2-13. W-bearing quartz vein from the Erdenesant area(summit, 1 site) 60
Fig. 2-14. W-bearing quartz vein from the Erdenesant area(north part of central,... 61
Fig. 2-15. W-bearing quartz vein from the Erdenesant area(north part of central,... 61
Fig. 2-16. Geological map of the Khangai REE-Nb-Ta occurrence 64
Fig. 2-17. Granite porphyry from K7 east site of the Khangai REE-Nb-Ta... 65
Fig. 2-18. Granite porphyry from K7 east site of the Khangai REE-Nb-Ta... 65
Fig. 2-19. Granite porphyry from K7 east site of the Khangai REE-Nb-Ta... 65
Fig. 2-20. Counter and contents of K, U and Th at the K3 site of Khangai... 66
Fig. 2-21. Fine or medium granite from K3 site of the Khangai REE-Nb-Ta... 67
Fig. 2-22. Counter and contents of K, U and Th of fine or medium granite frome... 67
Fig. 2-23. View of granitoid-related Cu mineralization from the Hayrhandulaan... 70
Fig. 2-24. Amphibolite (left) and granodiorite (right) from granitoid-related Cu... 70
Fig. 2-25. Banded gneiss (left) and pink feldspar granite (right) from porphyry Cu... 71
Fig. 2-26. Fe oxides (left) and Cu oxides (right) from porphyry Cu mineralization... 72
Fig. 2-27. Digging (left) and chalcopyrite (right) from porphyry Cu mineralization... 72
Fig. 2-28. Pink feldspar granite (left) and veins (right) from Cu-W-bearing greisen... 75
Fig. 2-29. View of Cu-W-bearing greisen and quartz veins of the Hayrhandulaan... 75
Fig. 2-30. Fe oxides (left) and Cu oxides (right) from Cu-W-bearing greisen and... 75
Fig. 2-31. Geological map of Cu mineralization at the Hayrhandulaan area 76
Fig. 2-32. Quartz vein from Cu mineralization of the Hayrhandulaan area(left=... 77
Fig. 2-33. Quartz vein (left) with cavity and quartz veins (right) of different stage... 77
Fig. 2-34. Granite (left) and quartz veins (right) from porphyry Mo-Cu... 78
Fig. 2-35. Wallrock alteration (left) and minerals (right) from porphyry Mo-Cu... 78
Fig. 2-36. Quartz vein (left) and quartz vein (right) of different stage from the... 81
Fig. 2-37. Sedimentary rocks (green) and igneous rocks (pink) from skarn Cu... 82
Fig. 2-38. Limestone (left) and granite porphyry (right) from skarn Cu... 82
Fig. 2-39. Cu oxides from skarn Cu mineralization of the Jargalan area 82
Fig. 2-40. Cu mineralization area (left) and sedimentary rocks (right) of the... 83
Fig. 2-41. Cu oxides from skarn Cu mineralization of the Jargalan area(left=... 83
Fig. 2-42. Trench (left) and grey white limestone (right) from skarn Cu... 88
Fig. 2-43. Cu oxides and epidote from skarn Cu mineralization of the Jargalan... 88
Fig. 2-44. Mineral resource map of the Bayanbulag soum area 89
Fig. 2-45. Igneous rocks from the Beliin-Tsahir W-Mo occurrence 90
Fig. 2-46. Greisen and quartz vein from the Beliin-Tsahir W-Mo occurrence 90
Fig. 2-47. Greisen and quartz vein, and fluorite from the Beliin-Tsahir W-Mo... 91
Fig. 2-48. Trench and rock cores from the Beliin-Tsahir W-Mo occurrence 91
Fig. 2-49. Geological map of the Zadgaibulag W occurrence 92
Fig. 2-50. Granite, black shale and contact from the Zadgaibulag W occurrence 93
Fig. 2-51. Contact between marble limestone and igneous rock from the... 93
Fig. 2-52. Hornblede granite (left) and quartz vein (right) from the... 94
Fig. 2-53. Trench of quartz veins from the Ovoot-Oendor Ta-Nb occurrence 95
Fig. 2-54. Pink feldspar granite from the Ovoot-Oendor Ta-Nb occurrence(left=... 96
Fig. 2-55. Quartz vein from the Unegt Au occurrence 97
Fig. 2-56. Quartz vein and trench from the Unegt Au occurrence 97
Fig. 2-57. Limestone(white) and granite(pink) from the Biluutiin-Gol Fe-Sn... 98
Fig. 2-58. Limestone, shale and granite from the Biluutiin-Gol Fe-Sn occurrence 98
Fig. 2-59. Fe mineralization from the Biluutiin-Gol Fe-Sn occurrence 99
Fig. 2-60. Trench from the Biluutiin-Gol Fe-Sn occurrence 99
Fig. 2-61. Skarn zone from the Biluutiin-Gol Fe-Sn occurrence 100
Fig. 2-62. Contact (left), hornblede granite (middle) and limesilicate (right) from... 100
Fig. 2-63. Mineral resource map (left) and view (right) of the Cu-Au occurrence 101
Fig. 2-64. Geological map of the Taatsyn-Gol-II Au-W occurrence(PR¹₁... 102
Fig. 2-65. View of the Taatsyn-Gol-II Au-W occurrenc 103
Fig. 2-66. Quartz vein and trench from the Taatsyn-Gol-II Au-W occurrence 104
Fig. 2-67. Quartz vein and Cu oxides from Cu mineralization of the... 105
Fig. 2-68. Quartz vein from Sn mineralization of the Khairkhandulaan soum area 105
Fig. 2-69. Tectonic province in Mongolia 108
Fig. 2-70. Fault system in the southwestern part of Mongolia 108
Fig. 2-71. Geology and geological structures around Toglog. E-W trending schist... 110
Fig. 2-72. Geology and geological structures around Toglog. Pinkish granite (a, b),... 111
Fig. 2-73. Pinkish granite developed in the 25 km of SSE Hayrhandulaan (a). E-W... 112
Fig. 2-74. Outcrops of the southern part of Hayrhandulaan. Grey to pale pinkish... 114
Fig. 2-75. Outcrops of the southern part of Hayrhandulaan. Quartz vein and... 115
Fig. 2-76. Geology and geological structures in the northern part of Jargalan.... 116
Fig. 3-1. Location map of major tungsten deposits in Mongolia 122
Fig. 3-2. Schematic distribution of tin, tungsten and molybdenum deposits and... 125
Fig. 3-3. (Left) Location map of Dulaankhaikhan W-Mo survey area and... 136
Fig. 3-4. Mineral distribution map of Bayan-Onjuul area and magnetic survey area and... 136
Fig. 3-5. Base station of magnetic survey 138
Fig. 3-6. Performing magnetic survey 138
Fig. 3-7. Topographic map of magnetic survey area and magnetic survey results 138
Fig. 3-8. Spectroscopic characteristics of major rock types in the survey area 140
Fig. 3-9. Correction of geologic map using remote sensing results 141
Fig. 3-10. Measurement lines and their heights of magnetic survey in the deposit I... 142
Fig. 3-11. Total magnetic anomaly map in the deposit I (left) and deposit II (right) 142
Fig. 3-12. Analyzed terrain map using GPS data in deposit I (left) and deposit II... 142
Fig. 3-13. 3D magnetic inversion result in the deposit I area. Red solid models... 144
Fig. 3-14. 3D magnetic inversion result in the deposit II area. Red solid models... 144
Fig. 3-15. 3D magnetic inversion result in the whole research area. Red solid... 145
Fig. 3-16. Interpolated total magnetic anomaly on the 2D grid points using Kriging... 146
Fig. 3-17. Analyzed 3D magnetic susceptibility model using 3D magnetic inversion. 146
Fig. 3-18. Geologic map of Dulaankhaikhan W-Mo survey area. Location of survey... 148
Fig. 3-19. Andesite and pegmatite vein in survey point 1. 149
Fig. 3-20. Intrusive pegmatite vein(red dashed line) between granite(on the right... 149
Fig. 3-21. Mining site in Ult gold deposit. 150
Fig. 3-22. Gold bearing quartzite in Ult gold deposit (left) and gold bearing... 150
Fig. 3-23. Wolframite bearing quartz vein intruded in andesite in survey point 8... 150
Fig. 3-24. X-ray diffraction pattern of tungsten containing quartz vein sample... 151
Fig. 3-25. Geologic map of Bayan-Onjuul survey area. Also, location of survey... 156
Fig. 3-26. Wolframite bearing quartz vein intruded in quartzite in Jurassic... 157
Fig. 3-27. Restored site after former trench investigation in survey point 6. 158
Fig. 3-28. SEM photograph and EDS result of W containing quartz vein sample... 158
Fig. 4-1. Main rare earth mineral 177
Fig. 4-2. Geologic map of Tri Le area 183
Fig. 4-3. Location map of the candidate area for soil geochemical exploration in the... 184
Fig. 4-4. Investigation map of grid soil geochemical exploration 185
Fig. 4-5. Photographs about soil geochemical exploration 186
Fig. 4-6. Location map of the first candidate area 187
Fig. 4-7. Panoramic view of the first candidate area (left), granite weathered zone... 188
Fig. 4-8. Distribution map of soil sample for the first candidate area 188
Fig. 4-9. TREO of the soil sample for the first candidate area 189
Fig. 4-10. Location map of the second candidate area. Mo=Monazite 190
Fig. 4-11. Panoramic view of the second candidate area 191
Fig. 4-12. Distribution map of the soil sample in the second candidate area 193
Fig. 4-13. TREO of the soil sample in the second candidate area 194
Fig. 4-14. Location map of the third candidate area 195
Fig. 4-15. Panoramic view of the third candidate area 197
Fig. 4-16. Distribution map of the soil sample in the third candidate area 198
Fig. 4-17. TREO of the soil sample in the third candidate area 199
Fig. 4-18. Soil geochemical anomaly map in Tri Le area(TREO) 202
Fig. 4-19. Soil geochemical anomaly map in Tri Le area(La+Ce) 203
Fig. 4-20. Soil geochemical anomaly map in Tri Le area(Y) 204
Fig. 4-21. Soil geochemical anomaly map in Tri Le area(La) 205
Fig. 4-22. Soil geochemical anomaly map in Tri Le area(Ce) 206
Fig. 4-23. Soil geochemical anomaly map in Tri Le area(Nd) 207
Fig. 4-24. Soil geochemical anomaly map in Tri Le area(Sm) 208
Fig. 4-25. Soil geochemical anomaly map in Tri Le area(Gd) 209
Fig. 4-26. Soil geochemical anomaly map in Tri Le area(Dy) 210
Fig. 4-27. Soil geochemical anomaly map in Tri Le area(Pr) 211
Fig. 4-28. Soil geochemical anomaly map in Tri Le area(Eu) 212
Fig. 4-29. Soil geochemical anomaly map in Tri Le area(Tb) 213
Fig. 4-30. Soil geochemical anomaly map in Tri Le area(Ho) 214
Fig. 4-31. Soil geochemical anomaly map in Tri Le area(Er) 215
Fig. 4-32. Soil geochemical anomaly map in Tri Le area(Tm) 216
Fig. 4-33. Soil geochemical anomaly map in Tri Le area(Yb) 217
Fig. 4-34. Soil geochemical anomaly map in Tri Le area(Lu) 218
Fig. 4-35. Sketch map of the cross-section in the 1-9 pit 227
Fig. 4-36. Photograph of the cross-section for the pit 1-9 228
Fig. 4-37. Sketch map of the cross-section in the 1-10 pit 229
Fig. 4-38. Photograph of the cross-section for the pit 1-10 230
Fig. 4-39. Sketch map of the cross-section in the pit 2-10 231
Fig. 4-40. Photograph of the cross-section for the pit 2-10 232
Fig. 4-41. Sketch map of the cross-section in the pit 18-2 233
Fig. 4-42. Photograph of the cross-section for the pit 18-2 234
Fig. 4-43. Sketch map of the cross-section in the pit 20-2 235
Fig. 4-44. Photograph of the cross-section for the pit 20-2 236
Fig. 4-45. Sketch map of the cross-section in the pit 21-1 237
Fig. 4-46. Photograph of the cross-section for the pit 21-1 238
Fig. 4-47. Sketch map of the cross-section in the pit 23-6 239
Fig. 4-48. Photograph of the cross-section for the pit 23-6 240
Fig. 4-49. Exploration plan in 2014 245
Fig. 5-1. Maps showing the location of 2013 KIGAM-DGSE Joint field survey... 247
Fig. 5-2. Topographic classification of Myanmar 247
Fig. 5-3. Plate tectonic setting adjacent to Myanmar. 248
Fig. 5-4. Schematic map showing the geological structure of Myanmar. 249
Fig. 5-5. Regional geological map of Myanmar. 251
Fig. 5-6. Stratigraphic chart of Myanmar. 252
Fig. 5-7. Major geotectonic units of Myanmar. 252
Fig. 5-8. Structural map of Myanmar. 258
Fig. 5-9. Geological blocks of Myanmar. 259
Fig. 5-10. Mineral commodity and mining license of Myanmar 260
Fig. 5-11. Metallogenic province of Myanmar. 260
Fig. 5-12. Location and geographic feature of Bophi Vum, Myanmar 263
Fig. 5-13. Geography and geology of Bophi Vum 264
Fig. 5-14. Photographs showing detailed surface survey. 267
Fig. 5-15. Geological map showing the distribution of Cr-ore bodies at Bophi Vum... 268
Fig. 5-16. Photographs of harzburgite outcrops 269
Fig. 5-17. Microphotographs showing serpentinized harzburgite in thin section.... 269
Fig. 5-18. Photographs showing outcrops of light yellowsh dunite 270
Fig. 5-19. Microphotographs showing serpentinized dunite in thin section, open... 271
Fig. 5-20. Photographs showing outcrops of dark greenish serpentinite 271
Fig. 5-21. Microphotographs showing serpentinite in thin section, open polarizd... 272
Fig. 5-22. Diagram of Ca-Mg-Fe pyroxenes 274
Fig. 5-23. Diagram of MgO vs. Al₂O₃ showing the compositional variations of... 274
Fig. 5-24. Compositional variation of clinopyroxene from chromitite, dunite,... 275
Fig. 5-25. Compositional variation of orthopyroxene from chromitite, dunite and... 276
Fig. 5-26. Photographs showing the ore bodies of podiform chromite in dunite... 278
Fig. 5-27. Photographs showing the ore bodies of massive chromite 278
Fig. 5-28. Photographs of chromite grains occurred as fine-grained disseminates... 278
Fig. 5-29. Photographs of chromite ore veins infilling along fault and fine... 279
Fig. 5-30. Photographs of chromite ore vein filling along the contact zone... 279
Fig. 5-31. Photographs of chromitite outcrops including dunite fragments. 280
Fig. 5-32. Photographs of chromitite ore veins occurring as net-works type in... 280
Fig. 5-33. Classification of the composition of chromian spinel from Bophi Vum... 283
Fig. 5-34. Atomic proportions of Fe³⁺, Cr, and AI for chromian spinels from... 284
Fig. 5-35. Mg# vs. Cr# diagram for chromian spinels from Bophi Vum,... 284
Fig. 5-36. Al₂O₃ vs. Fe²⁺/Fe³⁺ diagram for chromian spinels from Bophi Vum,... 285
Fig. 5-37. Al₂O₃ vs. TiO₂ diagram for chromian spinels from Bophi Vum,... 286
Fig. 5-38. (FeO/MgO)melt vs (Al₂O₃)melt (wt.%) calculated on the basis of the... 287
Fig. 5-39. Photographs for podiform chromitite: rock (upper); slab (middle);... 289
Fig. 5-40. Photographs for anti-podiform texture: rock (left); thin section (right... 290
Fig. 5-41. XRD patterns for podiform chromitite and serpentinite. 290
Fig. 5-42. Photographs of magnetite and silica veins in dunite matrix(left) and... 291
Fig. 5-43. Back-scattered electron image showing chromite magnetitization. 292
Fig. 5-44. Photographs of silica veins within dunite matrix. 293
Fig. 5-45. Photographs of outcrops covered with soils and debris. 294
Fig. 5-46. Geological map showing soil sampling sites and survey route(in the... 295
Fig. 5-47. Photographs showing geochemical exploration for surface soils: pitting... 296
Fig. 5-48. Comparision for concentrations of Cr, Ni and Fe between PXRF and... 301
Fig. 5-49. Comparision of analytical data between PXRF and ICP-AS... 302
Fig. 5-50. Diagram of Cr vs Ni showing correlationship of soil samples using by... 303
Fig. 5-51. Diagram of Cr vs Fe showing correlationship of soil samples using by... 303
Fig. 5-52. Diagram of Fe vs Ni showing correlationship of soil samples using by... 304
Fig. 5-53. Geochemical anomaly maps for Cr concentration for portable... 305
Fig. 5-54. Geochemical anomaly maps for Ni concentration for portable... 305
Fig. 5-55. Geochemical anomaly maps for Fe concentration for portable... 306
Fig. 5-56. Geochemical anomaly maps for Mn concentration for portable... 307
Fig. 5-57. Geological map and trench site in the study area. 308
Fig. 5-58. Photograph of the Backhoe Loaders of the JCB for excavating the... 308
Fig. 5-59. Photograph of the 1st trench for recognizing the chromite ore bodies... 309
Fig. 5-60. Photograph of the 2nd trench for recognizing the chromite... 310
Fig. 5-61. (a) & (b) Overview of the 2nd trench. (b) Photograph of the... 311
Fig. 5-62. Detailed grid map on the almost vertical plane of the trench section. Photo mosaic and detailed sketch map of the trench section. 312
Fig. 5-63. Photographs of the harzburgite. dunite and soil covered on the... 313
Fig. 5-64. Structural elements on the trench section, such as joints, veinlets,... 314
Fig. 5-65. (a) Portable XRF for the mineral analysis. (b), (c) & (d) Photograph... 315
Fig. 5-66. Detailed grid map and sketch in the range of 0 to 25 m on the trench section. 320
Fig. 5-67. Detailed grid map and sketch in the range of 26 to 50 m on the trench section. 321
Fig. 5-68. Detailed grid map and sketch in the range of 51 to 75 m on the trench section. 322
Fig. 5-69. Detailed grid map and sketch in the range of 76 to 100 m on the trench section. 323
Fig. 7-1. Mineral resources portal site 780
Fig. 7-2. The information of Fe-Mn mineralized area integrated google satellite... 782
Fig. 7-3. The infonnation of Au mineralized belt area integrated google satellite... 782
Fig. 7-4. Data of geophysical survey line integrated google satellite image and... 783
Fig. 7-5. Report of exploration of overseas mineral resources. (a) PDF format for... 783
Fig. 7-5. continued. (c) PDF format for the geological survey result of REE resources in... 784
Fig. 7-6. Japan JOGMEC's translated resources news articles 784
Fig. 8-1. The first Korea-Myanmar Economic cooperation committee 798
| 등록번호 | 청구기호 | 권별정보 | 자료실 | 이용여부 |
|---|---|---|---|---|
| 0002005561 | 622.13 -15-1 | 서울관 서고(열람신청 후 1층 대출대) | 이용가능 | |
| 0002005562 | 622.13 -15-1 | 서울관 서고(열람신청 후 1층 대출대) | 이용가능 |
*표시는 필수 입력사항입니다.
| 전화번호 |
|---|
| 기사명 | 저자명 | 페이지 | 원문 | 기사목차 |
|---|
| 번호 | 발행일자 | 권호명 | 제본정보 | 자료실 | 원문 | 신청 페이지 |
|---|
도서위치안내: / 서가번호:

우편복사 목록담기를 완료하였습니다.
*표시는 필수 입력사항입니다.
저장 되었습니다.
