 http://report.ndsl.kr/repDetail.do?cn=TRKO201500011188
권호기사보기
| 기사명 | 저자명 | 페이지 | 원문 | 기사목차 |
|---|
| 대표형(전거형, Authority) | 생물정보 | 이형(異形, Variant) | 소속 | 직위 | 직업 | 활동분야 | 주기 | 서지 | |
|---|---|---|---|---|---|---|---|---|---|
| 연구/단체명을 입력해주세요. | |||||||||
|
|
|
|
|
|
* 주제를 선택하시면 검색 상세로 이동합니다.
표제지
목차
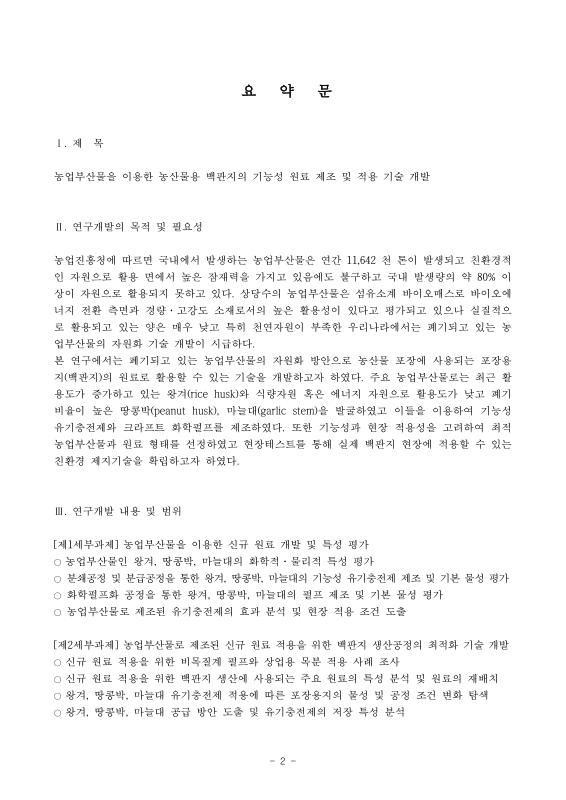
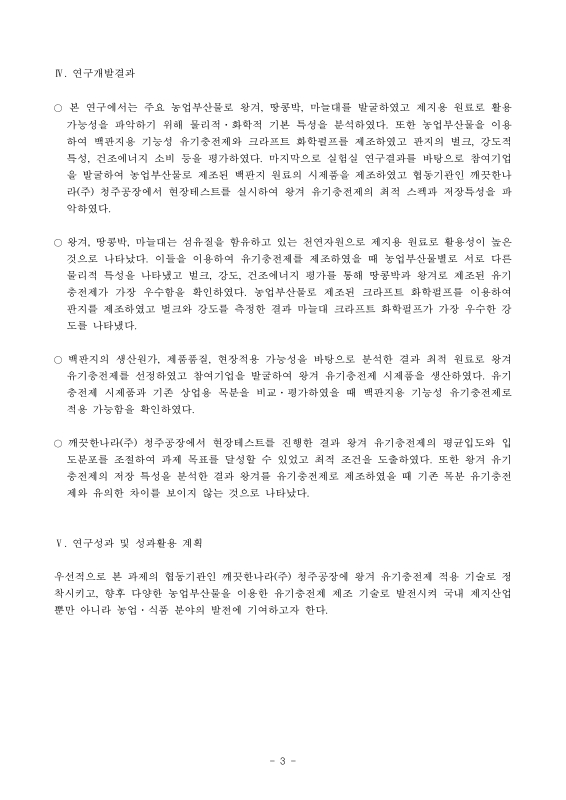
요약문 3
SUMMARY 5
제1장 연구개발과제의 개요 21
제2장 국내외 기술개발 현황 24
1절. 산업용지(판지)의 원료 동향 24
1. 판지의 종류에 따른 원료 분석 24
2. 한국산업표준(KS)에 따른 폐지(waste paper, recovered fibers)의 종류 28
2절. 주요 농업부산물의 현황 및 제지산업 적용 사례 29
1. 농업부산물의 종류 및 현황 29
2. 농업부산물의 판지 적용 사례 30
제3장 연구개발수행 내용 및 결과 37
1절. 농업부산물을 이용한 신규 원료 개발 및 특성 평가 37
1. 주요 농업부산물의 화학적ㆍ물리적 특성 평가 37
2. 농업부산물 유기충전제 제조 및 기본 물성 평가 43
3. 농업부산물 유기충전제의 효과 분석 64
4. 농업부산물 펄프의 물리적 특성 평가 92
5. 농업부산물 펄프의 혼합에 따른 판지의 물성 변화 104
2절. 농업부산물로 제조된 신규 원료 적용을 위한 백판지 생산현장의 최적화 기술 개발 126
1. 농산물용 백판지 생산에 사용되는 천연펄프와 재생펄프의 특성 분석 126
2. 부착량 변화에 따른 백판지의 주요 물성변화 파악 137
3/2. 농업부산물을 이용한 백판지용 원료 선정 및 시제품 생산 151
4/3. 현장지료 조건에서 왕겨 유기충전제 기능성 평가 161
3절. 왕겨 유기충전제의 적용 가능성 평가를 위한 현장테스트 및 최적 스펙 선정 168
1. 왕겨 유기충전제 적용을 위한 현장테스트 168
2. 왕겨 유기충전제의 저장 특성 평가 및 최종 스펙 선정 177
제4장 목표달성도 및 관련분야에의 기여도 185
1절. 최종 목표 185
2절. 목표 달성도 186
3절. 관련분야에의 기여도 186
제5장 연구개발 성과 및 성과활용 계획 187
1. 연구개발 목표 및 성과 187
2. 특허 출원 및 등록 188
3. 논문 게제 및 학회 발표 189
(1) 논문 게제 실적 189
(2) 학회 발표 실적 192
4. 성과활용 계획 193
5. 수상 실적 194
제6장 연구개발과정에서 수집한 해외과학기술정보 196
1. 중국 특수지 공장(전 국일제지) 방문 196
2. 포장 박람회(PROPAK CHINA 2014) 참관 197
가. Acepack (Packaging Machinery) 198
나. Yuanxupack (Yuanxupack AutoMachine) 199
다. NEWPACK(The Packaging Solution for Indian Ocean) 200
라. Cangzhou yuhui food machinery 202
마. Boevan (Shanghai Boevan Packaging Machinery Co.,Ltd) 203
2. Horizontal Packager (Doypack Packager) 205
3. 상하이 농산물 포장 동향에 대한 시장 조사 206
제7장 참고문헌 208
Fig. 1.1. Development and expectations of this research 21
Fig. 1.2. Effect of the bulk on the reduction of recycled fibers (left) and steam (right) 23
Fig. 1.3. Annual road-map of this research 23
Fig. 2.1. Classification of paperboard grades 24
Fig. 2.2. Structure of three-ply solid bleached board 25
Fig. 2.3. Structure of white lined chipboard 25
Fig. 2.4. Structure of testliner 25
Fig. 2.5. Structure of wallpaper base 26
Fig. 2.6. Structure of plaster board 26
Fig. 2.7. Scanning electron micrographs of rice husk fibers 36
Fig. 3.1. Chemical composition measurements of agricultural byproducts 38
Fig. 3.2. Scanning electron micrographs of the outer part of rice husk 40
Fig. 3.3. Scanning electron micrographs of the inner part of rice husk 41
Fig. 3.4. Scanning electron micrographs of the outer part of peanut husk 41
Fig. 3.5. Scanning electron micrographs of the inner part of peanut husk 41
Fig. 3.6. Scanning electron micrographs of the outer part of garlic stem 42
Fig. 3.7. Scanning electron micrographs of the inner part of garlic stem 42
Fig. 3.8. Manufacture of the agricultural byproducts organic filler 44
Fig. 3.9. Particle size measurement 45
Fig. 3.10. Fiber length measurement 45
Fig. 3.11. Average particle size of rice husk organic filler 46
Fig. 3.12. Average particle size of peanut husk organic filler 47
Fig. 3.13. Average particle size of garlic stem organic filler 47
Fig. 3.14. Particle size distribution of rice husk organic filler 48
Fig. 3.15. Particle size distribution of peanut husk organic filler 48
Fig. 3.16. Particle size distribution of garlic stem organic filler 49
Fig. 3.17. Particle size distribution of wood powder organic filler 49
Fig. 3.18. Average fiber length of rice husk organic filler 50
Fig. 3.19. Fiber length distribution of rice husk organic filler (R all) 51
Fig. 3.20. Fiber length distribution of rice husk organic filler (R 60-100) 51
Fig. 3.21. Fiber length distribution of rice husk organic filler (R 100-200) 52
Fig. 3.22. Fiber length distribution of rice husk organic filler (R 200) 52
Fig. 3.23. Scanning electron micrographs of rice husk organic filler (R all) 53
Fig. 3.24. Scanning electron micrographs of rice husk organic filler (R 60-100) 53
Fig. 3.25. Scanning electron micrographs of rice husk organic filler (R 100-200) 54
Fig. 3.26. Scanning electron micrographs of rice husk organic filler (R 200) 54
Fig. 3.27. Average fiber length of peanut husk organic filler 55
Fig. 3.28. Fiber length distribution of peanut husk organic filler (R all) 55
Fig. 3.29. Fiber length distribution of peanut husk organic filler (R 60-100) 56
Fig. 3.30. Fiber length distribution of peanut husk organic filler (R 100-200) 56
Fig. 3.31. Fiber length distribution of peanut husk organic filler (R 200) 57
Fig. 3.32. Scanning electron micrographs of peanut husk organic filler (R all) 57
Fig. 3.33. Scanning electron micrographs of peanut husk organic filler (R 60-100) 58
Fig. 3.34. Scanning electron micrographs of peanut husk organic filler (R 100-200) 58
Fig. 3.35. Scanning electron micrographs of peanut husk organic filler (R 200) 58
Fig. 3.36. Average fiber length of garlic stem organic filler 59
Fig. 3.37. Fiber length distribution of garlic stem organic filler (R all) 60
Fig. 3.38. Fiber length distribution of garlic stem organic filler (R 60-100) 60
Fig. 3.39. Fiber length distribution of garlic stem organic filler (R 100-200) 61
Fig. 3.40. Fiber length distribution of garlic stem organic filler (R 200) 61
Fig. 3.41. Scanning electron micrographs of garlic stem organic filler (R all) 62
Fig. 3.42. Scanning electron micrographs of garlic stem organic filler (R 60-100) 62
Fig. 3.43. Scanning electron micrographs of garlic stem organic filler (R 100-200) 63
Fig. 3.44. Scanning electron micrographs of garlic stem organic filler (R 200) 63
Fig. 3.45. Diagram of the experiments 67
Fig. 3.46. Effect of agricultural byproduct organic filler (all grade) and wood powder on the bulk of handsheets 68
Fig. 3.47. Effect of agricultural byproduct organic filler (60-100 grade) and wood powder on the bulk of handsheets 69
Fig. 3.48. Effect of agricultural byproduct organic filler (100-200 grade) on the bulk of handsheets 69
Fig. 3.49. Effect of agricultural byproduct organic filler (200 grade) and wood powder on the bulk of handsheets 70
Fig. 3.50. Effect of agricultural byproduct organic filler (all grade) and wood powder on the breaking length of handsheets 70
Fig. 3.51. Effect of agricultural byproduct organic filler (60-100 grade) and wood powder on the breaking length of handsheets 71
Fig. 3.52. Effect of agricultural byproduct organic filler (100-200 grade) and wood powder on the breaking length of handsheets 71
Fig. 3.53. Effect of agricultural byproduct organic filler (200 grade) and wood powder on the breaking length of handsheets 72
Fig. 3.54. Effect of agricultural byproduct organic filler (all grade) and wood powder on the burst factor of handsheets 72
Fig. 3.55. Effect of agricultural byproduct organic filler (60-100 grade) and wood powder on the burst factor of handsheets 73
Fig. 3.56. Effect of agricultural byproduct organic filler (100-200 grade) and wood powder on the burst factor of handsheets 73
Fig. 3.57. Effect of agricultural byproduct organic filler (200 grade) and wood powder on the burst factor of handsheets 74
Fig. 3.58. Effect of agricultural byproduct organic filler (all grade) and wood powder on the compressive factor of handsheets 74
Fig. 3.59. Effect of agricultural byproduct organic filler (60-100 grade) and wood powder on the compressive factor of handsheets 75
Fig. 3.60. Effect of agricultural byproduct organic filler (100-200 grade) and wood powder on the compressive factor of handsheets 75
Fig. 3.61. Effect of agricultural byproduct organic filler (200 grade) and wood powder on the compressive factor of handsheets 76
Fig. 3.62. Evaluation of the reduced drying energy of paperboard 77
Fig. 3.63. Effect of wood powder (all grade) on evaporated moisture content 77
Fig. 3.64. Effect of wood powder (all grade) on drying energy reduction 78
Fig. 3.65. Effect of 3% agricultural byproduct organic filler (all grade) on evaporated moisture content 79
Fig. 3.66. Effect of 6% agricultural byproduct organic filler (all grade) on evaporated moisture content 79
Fig. 3.67. Effect of 9% agricultural byproduct organic filler (all grade) on evaporated moisture content 80
Fig. 3.68. Effect of 3% agricultural byproduct organic filler (all grade) on drying energy reduction 80
Fig. 3.69. Effect of 6% agricultural byproduct organic filler (all grade) on drying energy reduction 81
Fig. 3.70. Effect of 9% agricultural byproduct organic filler (all grade) on drying energy reduction 81
Fig. 3.71. Effect of 3% agricultural byproduct organic filler (60-100 grade) on evaporated moisture content 82
Fig. 3.72. Effect of 6% agricultural byproduct organic filler (60-100 grade) on evaporated moisture content 82
Fig. 3.73. Effect of 9% agricultural byproduct organic filler (60-100 grade) on evaporated moisture content 83
Fig. 3.74. Effect of 3% agricultural byproduct organic filler (60-100 grade) on drying energy reduction 83
Fig. 3.75. Effect of 6% agricultural byproduct organic filler (60-100 grade) on drying energy reduction 84
Fig. 3.76. Effect of 9% agricultural byproduct organic filler (60-100 grade) on drying energy reduction 84
Fig. 3.77. Effect of 3% agricultural byproduct organic filler (100-200 grade) on evaporated moisture content 85
Fig. 3.78. Effect of 6% agricultural byproduct organic filler (100-200 grade) on evaporated moisture content 85
Fig. 3.79. Effect of 9% agricultural byproduct organic filler (100-200 grade) on evaporated moisture content 86
Fig. 3.80. Effect of 3% agricultural byproduct organic filler (100-200 grade) on drying energy reduction 86
Fig. 3.81. Effect of 6% agricultural byproduct organic filler (100-200 grade) on drying energy reduction 87
Fig. 3.82. Effect of 9% agricultural byproduct organic filler (100-200 grade) on drying energy reduction 87
Fig. 3.83. Effect of 3% agricultural byproduct organic filler (200 grade) on evaporated moisture content 88
Fig. 3.84. Effect of 6% agricultural byproduct organic filler (200 grade) on evaporated moisture content 88
Fig. 3.85. Effect of 9% agricultural byproduct organic filler (200 grade) on evaporated moisture content 89
Fig. 3.86. Effect of 3% agricultural byproduct organic filler (200 grade) on drying energy reduction 89
Fig. 3.87. Effect of 6% agricultural byproduct organic filler (200 grade) on drying energy reduction 90
Fig. 3.88. Effect of 9% agricultural byproduct organic filler (200 grade) on drying energy reduction 90
Fig. 3.89. Fiber length of rice husk pulp as a function of pulping conditions 96
Fig. 3.90. Fiber width of rice husk pulp as a function of pulping conditions 97
Fig. 3.91. Fiber length of peanut husk pulp as a function of pulping conditions 97
Fig. 3.92. Fiber length of peanut husk pulp as a function of pulping conditions 98
Fig. 3.93. Fiber length of garlic stem pulp as a function of pulping conditions 98
Fig. 3.94. Fiber width of garlic stem pulp as a function of pulping conditions 99
Fig. 3.95. Scanning electron micrograph (left) and optical micrograph (right) of rice husk pulp at active alkali 20% and sulfidity 25% conditions 100
Fig. 3.96. Scanning electron micrograph (left) and optical micrograph (right) of rice husk pulp at active alkali 30% and sulfidity 30% conditions 100
Fig. 3.97. Scanning electron micrograph (left) and optical micrograph (right) of peanut husk pulp at active alkali 20% and sulfidity 25% conditions 101
Fig. 3.98. Scanning electron micrograph (left) and optical micrograph (right) of peanut husk pulp at active alkali 30% and sulfidity 30% conditions 101
Fig. 3.99. Scanning electron micrograph (left) and optical micrograph (right) of garlic stem pulp at active alkali 20% and sulfidity 25% conditions 102
Fig. 3.100. Scanning electron micrograph (left) and optical micrograph (right) of garlic stem pulp at active alkali 30% and sulfidity 30% conditions 102
Fig. 3.101. Micrograph of BCTMP 103
Fig. 3.102. Micrograph of OCC 103
Fig. 3.103. Scanning electron micrographs of rice husk pulp fibers at active alkali 20% and sulfidity 25% conditions 106
Fig. 3.104. Scanning electron micrographs of rice husk pulp fibers at active alkali 30% and sulfidity 30% conditions 107
Fig. 3.105. Scanning electron micrographs of peanut husk pulp fibers at active alkali 20% and sulfidity 25% conditions 107
Fig. 3.106. Scanning electron micrographs of peanut husk pulp fibers at active alkali 30% and sulfidity 30% conditions 108
Fig. 3.107. Scanning electron micrographs of garlic stem pulp fibers at active alkali 20% and sulfidity 25% conditions 108
Fig. 3.108. Scanning electron micrographs of garlic stem pulp fibers at active alkali 30% and sulfidity 30% conditions 109
Fig. 3.109. Scanning electron micrograph of KOCC fibers (×200) 109
Fig. 3.110. Scanning electron micrograph of KOCC fibers (×1000) 110
Fig. 3.111. Bulk of handsheet containing KOCC and agricultural byproduct pulps manufactured at active alkali 20% and sulfidity 25% conditions (A) 111
Fig. 3.112. Bulk of handsheet containing KOCC and agricultural byproduct pulps manufactured at active alkali 20% and sulfidity 35% conditions (B) 112
Fig. 3.113. Bulk of handsheet containing KOCC and agricultural byproduct pulps manufactured at active alkali 25% and sulfidity 35% conditions (C) 112
Fig. 3.114. Bulk of handsheet containing KOCC and agricultural byproduct pulps manufactured at active alkali 30% and sulfidity 20% conditions (D) 113
Fig. 3.115. Bulk of handsheet containing KOCC and agricultural byproduct pulps manufactured at active alkali 30% and sulfidity 30% conditions (E) 113
Fig. 3.116. Ash content of handsheet containing KOCC and agricultural byproduct pulps manufactured at active alkali 20% and sulfidity 25% conditions (A) 114
Fig. 3.117. Ash content of handsheet containing KOCC and agricultural byproduct pulps manufactured at active alkali 20% and sulfidity 35% conditions (B) 114
Fig. 3.118. Ash content of handsheet containing KOCC and agricultural byproduct pulps manufactured at active alkali 25% and sulfidity 35% conditions (C) 115
Fig. 3.119. Ash content of handsheet containing KOCC and agricultural byproduct pulps manufactured at active alkali 30% and sulfidity 20% conditions (D) 115
Fig. 3.120. Ash content of handsheet containing KOCC and agricultural byproduct pulps manufactured at active alkali 30% and sulfidity 30% conditions (E) 116
Fig. 3.121. Tensile strength of handsheet containing KOCC and agricultural byproduct pulps manufactured at active alkali 20% and sulfidity 25% conditions (A) 118
Fig. 3.122. Breaking length of handsheet containing KOCC and agricultural byproduct pulps manufactured at active alkali 20% and sulfidity 35% conditions (B) 118
Fig. 3.123. Breaking length of handsheet containing KOCC and agricultural byproduct pulps manufactured at active alkali 25% and sulfidity 35% conditions (C) 119
Fig. 3.124. Breaking length of handsheet containing KOCC and agricultural byproduct pulps manufactured at active alkali 30% and sulfidity 20% conditions (D) 119
Fig. 3.125. Breaking length of handsheet containing KOCC and agricultural byproduct pulps manufactured at active alkali 30% and sulfidity 30% conditions (E) 120
Fig. 3.126. Compressive strength of handsheet containing KOCC and agricultural byproduct pulps manufactured at active alkali 20% and sulfidity 25% conditions (A) 120
Fig. 3.127. Compressive strength of handsheet containing KOCC and agricultural byproduct pulps manufactured at active alkali 20% and sulfidity 35% conditions (B) 121
Fig. 3.128. Compressive factor of handsheet containing KOCC and agricultural byproduct pulps manufactured at active alkali 25% and sulfidity 35% conditions 121
Fig. 3.129. Compressive strength of handsheet containing KOCC and agricultural byproduct pulps manufactured at active alkali 30% and sulfidity 20% conditions 122
Fig. 3.130. Compressive factor of handsheet containing KOCC and agricultural byproduct pulps manufactured at active alkali 30% and sulfidity 30% conditions 122
Fig. 3.131. Burst strength of handsheet containing KOCC and agricultural byproduct pulps manufactured at active alkali 20% and sulfidity 25% conditions 123
Fig. 3.132. Burst strength of handsheet containing KOCC and agricultural byproduct pulps manufactured at active alkali 20% and sulfidity 35% conditions 123
Fig. 3.133. Burst strength of handsheet containing KOCC and agricultural byproduct pulps manufactured at active alkali 25% and sulfidity 35% conditions 124
Fig. 3.134. Burst strength of handsheet containing KOCC and agricultural byproduct pulps manufactured at active alkali 30% and sulfidity 20% conditions 124
Fig. 3.135. Burst strength of handsheet containing KOCC and agricultural byproduct pulps manufactured at active alkali 30% and sulfidity 30% conditions 125
Fig. 3.136. Freeness of commercial pulps 128
Fig. 3.137. Average fiber length of commercial pulps 128
Fig. 3.138. Fiber length distribution of BKP 129
Fig. 3.139. Fiber length distribution of BCTMP 129
Fig. 3.140. Fiber length distribution of white ledger 130
Fig. 3.141. Fiber length distribution of ONP 130
Fig. 3.142. Fiber length distribution of OCC 131
Fig. 3.143. Fines content of commercial pulps 131
Fig. 3.144. Micrographs of BKP 132
Fig. 3.145. Micrographs of BCTMP 132
Fig. 3.146. Micrographs of white ledger 132
Fig. 3.147. Micrographs of ONP 133
Fig. 3.148. Micrographs of OCC 133
Fig. 3.149. Ash content of commercial pulps 134
Fig. 3.150. Bulk of handsheets made of commercial pulps 135
Fig. 3.151. Tensile strength of handsheets made of commercial pulps 135
Fig. 3.152. Compressive strength of handsheets made of commercial pulps 136
Fig. 3.153. Burst strength of handsheets made of commercial pulps 136
Fig. 3.154. Basis weights of top and bottom layers as a function of the bulk of SC 350 g/m² 139
Fig. 3.155. Basis weights of top and bottom layers as a function of the brightness of SC 350 g/m² 140
Fig. 3.156. Basis weights of top and bottom layers as a function of the Park print surf of SC 350 g/m² 140
Fig. 3.157. Basis weights of top and bottom layers as a function of the folding endurance (MD) of SC 350 g/m² 141
Fig. 3.158. Basis weights of top and bottom layers as a function of the folding endurance (CD) of SC 350 g/m² 141
Fig. 3.159. Basis weights of top and bottom layers as a function of the stiffness (MD) of SC 350 g/m² 142
Fig. 3.160. Basis weights of top and bottom layers as a function of the stiffness (CD) of SC 350 g/m² 142
Fig. 3.161. Basis weights of top and bottom layers as a function of the bulk of ACB 220 g/m² 143
Fig. 3.162. Basis weights of top and bottom layers as a function of the brightness of ACB 220 g/m² 144
Fig. 3.163. Basis weights of top and bottom layers as a function of the Park print surf of ACB 220 g/m² 144
Fig. 3.164. Basis weights of top and bottom layers as a function of the folding endurance (MD) of ACB 220 g/m² 145
Fig. 3.165. Basis weights of top and bottom layers as a function of the folding endurance (CD) of ACB 220 g/m² 145
Fig. 3.166. Basis weights of top and bottom layers as a function of the stiffness (MD) of ACB 220 g/m² 146
Fig. 3.167. Basis weights of top and bottom layers as a function of the stiffness (MD) of ACB 220 g/m² 146
Fig. 3.168. Basis weights of top and bottom layers as a function of the bulk of SC 450 g/m² 147
Fig. 3.169. Basis weights of top and bottom layers as a function of the brightness of SC 450g/m² 147
Fig. 3.170. Basis weights of top and bottom layers as a function of the Park print surf of SC 450 g/m² 148
Fig. 3.171. Basis weights of top and bottom layers as a function of the folding endurance (MD) of SC 450 g/m² 148
Fig. 3.172. Basis weights of top and bottom layers as a function of the folding endurance (CD) of SC 450 g/m² 149
Fig. 3.173. Basis weights of top and bottom layers as a function of the stiffness (MD) of SC 450 g/m² 149
Fig. 3.174. Basis weights of top and bottom layers as a function of the stiffness (CD) of SC 450 g/m² 150
Fig. 3.175. Flow diagram of the evaluation of agricultural byproducts 152
Fig. 3.176. Dryer for the production of organic filler 156
Fig. 3.177. Grinder for the production of organic filler 156
Fig. 3.178. Screens for the production of organic filler 157
Fig. 3.179. Rice husk for the production of organic filler 157
Fig. 3.180. Rice husk organic filler 158
Fig. 3.181. Relationship between fiber length and width of rice husk organic filler 158
Fig. 3.182. Relationship between fiber length and width of WP1 organic filler 159
Fig. 3.183. Relationship between fiber length and width of WP2 organic filler 159
Fig. 3.184. Scanning electron micrographs of rice husk organic filler 160
Fig. 3.185. Scanning electron micrographs of WP2 organic filler 160
Fig. 3.186. Effect of organic filler on the bulk of handsheets 163
Fig. 3.187. Effect of organic filler on the tensile strength of handsheets 163
Fig. 3.188. Effect of organic filler on the burst strength of handsheets 164
Fig. 3.189. Effect of organic filler on the compressive strength of handsheets 164
Fig. 3.190. Effect of rice husk organic filler on the evaporated moisture content of handsheets 165
Fig. 3.191. Effect of wood powder 1 organic filler on the evaporated moisture content of handsheets 166
Fig. 3.192. Effect of wood powder 2 organic filler on the evaporated moisture content of handsheets 166
Fig. 3.193. Effect of organic filler on the reduced drying energy requirement of handsheets 167
Fig. 3.194. Rice husk organic filler for mill tests 169
Fig. 3.195. Sampling of rice husk organic filler 169
Fig. 3.196. Air blower and pipe lines to rice husk organic filler chest 169
Fig. 3.197. Rice husk organic filler chest 170
Fig. 3.198. Structure of duplexboard 170
Fig. 3.199. Papermaking process of duplexboard 170
Fig. 3.200. Rice husk particles remaining on 60 mesh sieve 172
Fig. 3.201. Yield of rice husk organic filler fractionated by 60, 100, 200 mesh sieves 172
Fig. 3.202. Thermo-hygrostat and aging conditions 178
Fig. 3.203. Appearance and color of commercial wood powder(left), rice husk organic filler (middle), rice husk(right) before humid heating aging 179
Fig. 3.204. Appearance and color of commercial wood powder(left), rice husk organic filler (middle), rice husk(right) after 2 days of humid heating aging 179
Fig. 3.205. Appearance and color of commercial wood powder(left), rice husk organic filler (middle), rice husk(right) after 4 days of humid heating aging 179
Fig. 3.206. Appearance and color of commercial wood powder(left), rice husk organic filler (middle), rice husk(right) after 6 days of humid heating aging 180
Fig. 3.207. Appearance and color of commercial wood powder(left), rice husk organic filler (middle), rice husk(right) after 8 days of humid heating aging 180
Fig. 3.208. Appearance and color of commercial wood powder(left), rice husk organic filler (middle), rice husk(right) after 10 days of humid heating aging 180
Fig. 3.209. Appearance and color of commercial wood powder(left), rice husk organic filler (middle), rice husk(right) after 12 days of humid heating aging 181
Fig. 3.210. Appearance and color of commercial wood powder(left), rice husk organic filler (middle), rice husk(right) after 14 days of humid heating aging 181
Fig. 3.211. Appearance and color of commercial wood powder(left), rice husk organic filler (middle), rice husk(right) after 16 days of humid heating aging 181
Fig. 3.212. Appearance and color of commercial wood powder(left), rice husk organic filler (middle), rice husk(right) after 18 days of humid heating aging 182
Fig. 3.213. Appearance and color of commercial wood powder(left), rice husk organic filler (middle), rice husk(right) after 20 days of humid heating aging 182
Fig. 3.214. Magnified images of rice husk after 20 days of humid heating aging 182
Fig. 3.215. Weight change of commercial wood powder, rice husk organic filler, rice husk during 20 days of humid heating aging 183
Fig. 3.216. Addition of rice husk organic filler in paperboard mill 184
Fig. 6.1. Pictures of KOOKIL PAPER (国一制纸(张家港)有限公司) 197
Fig. 6.2. Pictures of PROPAK CHINA 2014 198
Fig. 6.3. Packaging trends for agricultural products in Shanghai market 204
*표시는 필수 입력사항입니다.
| 전화번호 |
|---|
| 기사명 | 저자명 | 페이지 | 원문 | 기사목차 |
|---|
| 번호 | 발행일자 | 권호명 | 제본정보 | 자료실 | 원문 | 신청 페이지 |
|---|
도서위치안내: / 서가번호:

우편복사 목록담기를 완료하였습니다.
*표시는 필수 입력사항입니다.
저장 되었습니다.
