 http://library.me.go.kr/search/DetailView.Popup.ax?sid=4&cid=5590438


권호기사보기
| 기사명 | 저자명 | 페이지 | 원문 | 기사목차 |
|---|
| 대표형(전거형, Authority) | 생물정보 | 이형(異形, Variant) | 소속 | 직위 | 직업 | 활동분야 | 주기 | 서지 | |
|---|---|---|---|---|---|---|---|---|---|
| 연구/단체명을 입력해주세요. | |||||||||
|
|
|
|
|
|
* 주제를 선택하시면 검색 상세로 이동합니다.
표제지
목차
제출문 2
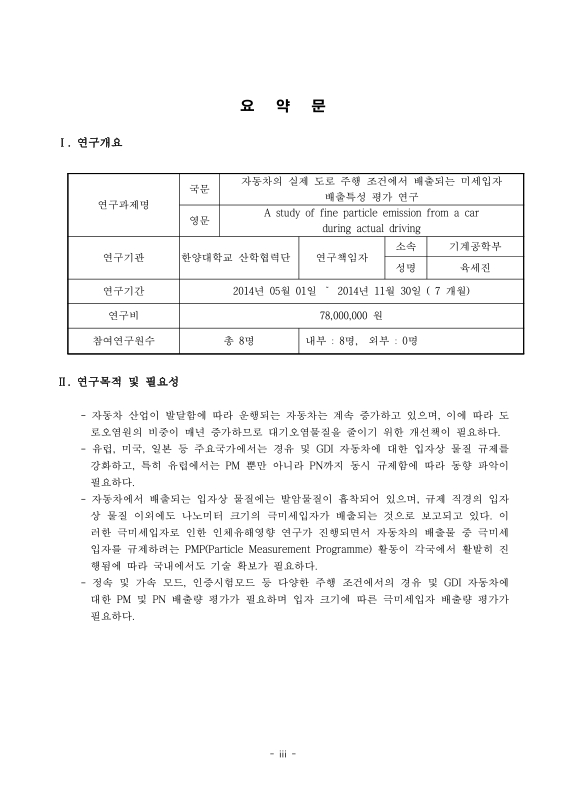
요약문 4
Ⅰ. 서론 20
1. 연구 배경 20
2. 연구 목적 23
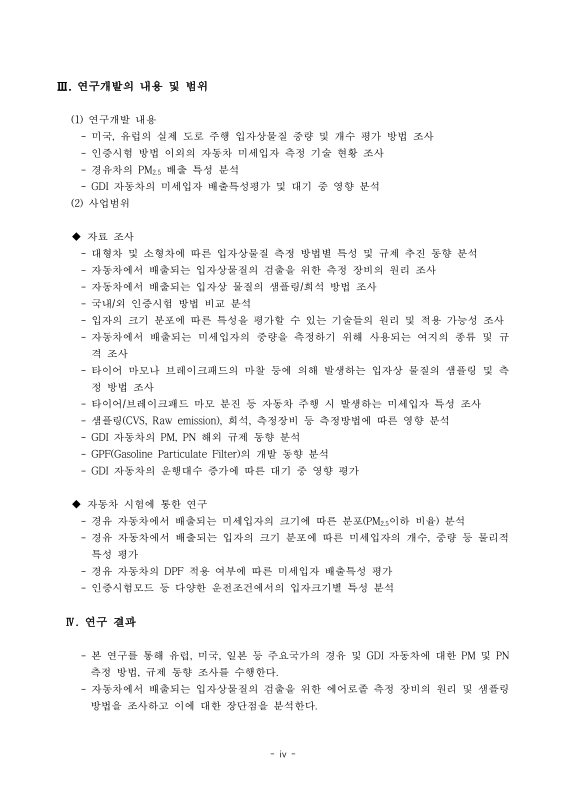
Ⅱ. 본론 24
1. 미국, 유럽의 실제 도로 주행 입자상물질 중량 및 개수 평가 방법 조사 24
가. 대형차 및 소형차에 따른 입자상물질 측정 방법별 특성 및 규제 추진 동향 분석 24
나. 자동차에서 배출되는 입자상 물질의 검출을 위한 측정 장비의 원리 조사 53
다. 자동차에서 배출되는 입자상 물질의 샘플링/희석 방법 조사 88
라. 국내/외 인증 시험 방법 비교 98
2. 인증시험 방법 이외의 자동차 미세입자 측정 기술 현황 조사 104
가. 입자의 크기 분포에 따른 특성을 평가할 수 있는 기술들의 원리 및 적용 가능성 조사 104
나. 자동차에서 배출되는 미세입자의 중량을 측정하기 위해 사용되는 여지의 종류 및 규격 조사 116
다. 타이어의 마모나 브레이크패드의 마찰 등에 의해 발생하는 입자상물질의 샘플링 및 측정방법 조사 119
라. 타이어 마모 분진, 브레이크패드 분진 등 자동차 주행 시 발생하는 미세입자 특성 조사 120
3. 경유차의 PM2.5 배출 특성 분석 122
가. 경유차에서 배출되는 미세입자의 크기에 따른 분포(PM2.5이하 비율) 분석 122
나. 경유차에서 배출되는 입자의 크기 분포에 따른 미세입자의 개수, 중량 등 물리적 특성 평가 123
다. 샘플링(CVS, raw emission), 희석, 측정 장비 등 측정방법 조사 124
라. DPF 적용 여부에 따른 미세입자 배출특성 평가 125
마. 경유차에서 배출되는 미세입자의 배출 특성 연구 126
4. GDI 자동차의 미세입자 배출특성평가 및 대기 중 영향 평가 158
가. GDI 자동차의 PM, PN 해외 규제 동향 분석 158
나. GDI 자동차의 운행대수 증가에 따른 대기 중 영향평가 169
다. GPF 개발 동향 분석 175
라. 인증시험모드 등 다양한 운전조건에서의 입자크기 별 특성 분석 178
마. 연구결과 및 고찰 185
Ⅲ. 결론 200
가. 미국, 유럽의 실제 도로 주행 입자상물질 중량 및 개수 평가 방법 조사 200
나. 인증시험 방법 이외의 자동차 미세입자 측정 기술 현황 조사 200
다. 경유차의 PM2.5 배출 특성 분석 201
라. GDI 자동차의 미세입자 배출 특성 평가 및 대기 중 영향 평가 203
Ⅳ. 기대성과 또는 향후계획 206
1. 기대성과 206
2. 향후계획 207
Ⅴ. 참고문헌 208
Fig. 1-1. 미세먼지(PM10) 발생원별 비율 21
Fig. 1-2. 초미세먼지(PM2.5) 발생원별 비율 21
Fig. 1-3. Vehicle emission proposal for EURO 6 (first step engineering target : 70%) 22
Fig. 2-1. 직접 채취하는 분석 시스템 유로도 25
Fig. 2-2. 희석 채취하는 분석 시스템 유로도 25
Fig. 2-3. ECE regulation 49, 83 28
Fig. 2-4. ECE regulation 49, 83 32
Fig. 2-5. Exhaust gas sampling system(CFV-CVS) 36
Fig. 2-6. Experimental setup 53
Fig. 2-7. HC emissions and the impact of CRDPF-1 (a) and CRDPF-2 (b) on their reduction 55
Fig. 2-8. CO emissions and impact of CRDPF-1 (a) and CRDPF-2 (b) on their reduction 55
Fig. 2-9. NOx emissions and the impact of CRDPF-1 (a) and CRDPF-2 (b) on their reduction 56
Fig. 2-10. Number-size distribution of the particles upstream and downstream of the CRDPFs 56
Fig. 2-11. Particle mass and the impact of CRDPF-1 (a) and CRDPF-2 (b) on their reduction 57
Fig. 2-12. A schematic drawing of the sampling setup 57
Fig. 2-13. Measured diesel particle size distributions with standard deviations at 75% load at an engine speed of 1500 rpm [dN/d log Dp (1/cm³)]. Numbers describe the averages of particle size distribution... 58
Fig. 2-14. Amounts of deposited particle doses into the respiratory system of an adult male at different levels of exercise: (A) without a catalyst; (B) with an SCR unit; (C) with DPF. ET1=anterior nose,... 59
Fig. 2-15. Calculated deposited particle doses to the respiratory system of an adult male during sitting and heavy exercise and time of different engine conditions: (A) without a catalyst; (B) with an SCR unit... 60
Fig. 2-16. Proportions of particles deposited in the five regions of the respiratory tract of an adult male during (A) sitting or (B) heavy exercise ET1=anterior nose, ET2=main extrathoracic region,... 61
Fig. 2-17. Schematic diagram of the sampling set-up 62
Fig. 2-18. Concentration of nitrogen oxides (A), carbon monoxide (B), carbon dioxide (C), gaseous hydrocarbons (D) measured in raw exhaust and corresponding exhaust gas temperature (E) 63
Fig. 2-19. Particle mass calculated from ELPI number size distributions. The error bars show the standard deviations for the corresponding operational conditions 64
Fig. 2-20. SMPS number size distributions for various engine operating conditions 64
Fig. 2-21. Particle count median diameter. The error bars show the corresponding standard errors 65
Fig. 2-22. Total number concentration as calculated from SMPS number size distribution Standard deviation is represented by vertical error bars 65
Fig. 2-23. Comparison of particle number size distributions measured by SMPS and ELPI for low and high loads at 1080 rpm speed 66
Fig. 2-24. Setup of the parked HDDT (Heavy-duty diesel trucks) 67
Fig. 2-25. Contour plot showing EEPS(C₁) number-based size distributions during 3-A, an Initial Regeneration of the 2007 HDDT 68
Fig. 2-26. Tunnel emissions over all sequence phases measured by EEPS(C₁), SMPS, DMM,a nd DustTrak during test3-A, an initial regeneration of the 2007 HDDT 68
Fig. 2-27. PM₁, PM2.5, and PM10 concentrations simultaneously measured by the DustTrak during two initial regenerations of the 2007 HDDT : (A) test 3-A and (B) test 2-A 69
Fig. 2-28. 2007 HDDT: average tunnel emissions measured SMPS, EEPS (C₁C₂), DustTrak, DMM, and gravimetric filters during (A) initial regenerations and (B) subsequent regenerations 69
Fig. 2-29. Experimental setup 70
Fig. 2-30. Particle number size distribution 71
Fig. 2-31. Number (DMS) and mass emission factors (EF, nano-MOUDI) 72
Fig. 2-32. Size distribution of thermodenuded aerosols for cruise mode 72
Fig. 2-33. Size distribution of thermodenuded aerosols for cruise mode 73
Fig. 2-34. Non-volatile mass fraction at different thermodenuder temperature settings 73
Fig. 2-35. Schematics of instrument layout during on-board emissions sampling (Holmén et al., 2005) 74
Fig. 2-36. Particle number and mass emission rates for a three-minute segment of the urban arterial 75
Fig. 2-37. Particle number and mass emission rates for a three-minute segment of the rural arterial 76
Fig. 2-38. Particle number and mass emission rates for a three-minute segment of divided freeway 77
Fig. 2-39. Scanning mobility particle sizer 78
Fig. 2-40. EEPS 79
Fig. 2-41. EEPS 79
Fig. 2-42. ELPI 80
Fig. 2-43. Operating principle 80
Fig. 2-44. Operating principle 81
Fig. 2-45. DMM 82
Fig. 2-46. Operating principle 82
Fig. 2-47. Operating principle 83
Fig. 2-48. Cyclone 84
Fig. 2-49. PPS-M 84
Fig. 2-50. Operating principle 85
Fig. 2-51. 초미량 PM 분석 장치 86
Fig. 2-52. Operating principle 86
Fig. 2-53. APC 87
Fig. 2-54. Experimental setup for testing diesel particulate filters 88
Fig. 2-55. Experimental set-up for PFD to CVS comparison 88
Fig. 2-56. A mini-dilution tunnel and sampling (MDTS) measurement system 89
Fig. 2-57. Phase 1에서의 PFD와 CVS의 dilution factor와 CO₂ 90
Fig. 2-58. Phase 1, 2에서의 PFD와 CVS의 Total PM 비교 91
Fig. 2-59. A mini-dilution tunnel and sampling (MDTS) measurement system 91
Fig. 2-60. An ejector-diluter and sampling (EDS) measurement system 92
Fig. 2-61. CVS의 개략도 93
Fig. 2-62. Porous tube diluter 구조 및 원리 94
Fig. 2-63. Ejector diluter의 구조 94
Fig. 2-64. Rotating disk diluter의 구조 및 원리 95
Fig. 2-65. Bifurcated flow diluter의 기본 개요도 96
Fig. 2-66. Condensation particle counter 104
Fig. 2-67. Principle of condensation particle counter 104
Fig. 2-68. Principle of optical particle counter 105
Fig. 2-69. Mie scattering. Relationship between diameter and scattered intensity for water droplet 106
Fig. 2-70. Principle of aerosol electrometer 107
Fig. 2-71. Principle of electrical aerosol detector 108
Fig. 2-72. Principle of ultrafine particle monitor 108
Fig. 2-73. Principle of DMA 109
Fig. 2-74. Principle of aerodynamic particle sizer 109
Fig. 2-75. Principle of electrostatic precipitator 110
Fig. 2-76. Emfab filters 116
Fig. 2-77. Membrane filters (PTFE) 116
Fig. 2-78. Membrane filters (Hydrophobic PTFE) 117
Fig. 2-79. PTFE membrane filters 118
Fig. 2-80. Glass fiber filters 118
Fig. 3-1. 경유 자동차 배출가스 시험 장치도 127
Fig. 3-2. 각 시험 모드의 Velocity profile 132
Fig. 3-3. NEDC 모드에서의 Total PN concentration (EEPS) 133
Fig. 3-4. NEDC 모드에서의 Total PN concentration (SPCS) 133
Fig. 3-5. NEDC 모드에서의 Cold, Hot 조건에 따른 Total PN concentration 비교 134
Fig. 3-6. NEDC 모드에서의 Cold, Hot 조건에 따른 크기별 Total PN concentration 비교 134
Fig. 3-7. NIER 6 모드에서의 Total PN concentration (EEPS) 135
Fig. 3-8. NIER 9 모드에서의 Total PN concentration (EEPS) 135
Fig. 3-9. NIER 6 모드에서의 Total PN concentration (SPCS) 136
Fig. 3-10. NIER 9 모드에서의 Total PN Concentration (SPCS) 136
Fig. 3-11. NIER 6, NIER 9 모드에서의 반복 주행에 따른 Total PN concentration 비교 137
Fig. 3-12. NIER 6 모드에서의 크기별 Total PN concetration 137
Fig. 3-13. NIER 9 모드에서의 크기별 Total PN concentration 138
Fig. 3-14. NEDC, NIER 6, NIER 9 모드의 Total PN concentration 비교 138
Fig. 3-15. 정속 모드에서 경사도 및 속도에 따른 Total PN concentration 비교 139
Fig. 3-16. 가속 모드에서 경사도 및 속도에 따른 Total PN concentration 비교 140
Fig. 3-17. CVS-75 (1 Phase) 모드에서의 Total PN concentration (SPCS) 141
Fig. 3-18. CVS-75 (1 Phase) 모드에서의 크기별 미세입자 중량 농도 (DLPI) 142
Fig. 3-19. NIER 6 모드에서의 Total PN concentration (SPCS) 143
Fig. 3-20. NIER 9 모드에서의 Total PN concentration (SPCS) 144
Fig. 3-21. NIER 6 모드에서의 크기별 미세입자 중량 농도 (DLPI) 146
Fig. 3-22. NIER 9 모드에서의 크기별 미세입자 중량 농도 (DLPI) 146
Fig. 3-23. 20 km/h 정속 모드에서의 Total PN concentration (SPCS) 147
Fig. 3-24. 40 km/h 정속 모드에서의 Total PN concentration (SPCS) 148
Fig. 3-25. 60 km/h 정속 모드에서의 Total PN concentration (SPCS) 148
Fig. 3-26. 20 km/h 정속 모드에서의 크기별 미세입자 중량 농도 (DLPI) 150
Fig. 3-27. 40 km/h 정속 모드에서의 크기별 미세입자 중량 농도 (DLPI) 150
Fig. 3-28. 60 km/h 정속 모드에서의 크기별 미세입자 중량 농도 (DLPI) 151
FIg. 3-29. 0 to 60 km/h, 20 sec(0.833 m/s²) 가속 모드에서의 Total PN concentration (SPCS) 152
FIg. 3-30. 0 to 60 km/h, 30 sec(0.555 m/s²) 가속 모드에서의 Total PN concentration (SPCS) 152
FIg. 3-31. 0 to 60 km/h, 40 sec(0.417 m/s²) 가속 모드에서의 Total PN concentration (SPCS) 153
Fig. 3-32. 0 to 60 km/h, 20 sec(0.833 m/s²) 가속 모드에서의 크기별 미세입자 중량 농도 (DLPI) 154
Fig. 3-33. 0 to 60 km/h, 30 sec(0.555 m/s²) 가속 모드에서의 크기별 미세입자 중량 농도 (DLPI) 155
Fig. 3-34. 0 to 60 km/h, 40 sec(0.417 m/s²) 가속 모드에서의 크기별 미세입자 중량 농도 (DLPI) 155
Fig. 4-1. NEDC 주행 모드 속도 Profile 및 특징 161
Fig. 4-2. WLTP 주행 모드 속도 Profile 및 특징 162
Fig. 4-3. RDE-LDV제도 도입 방안 및 장단점 163
Fig. 4-4. CVS-75 주행 모드 속도 Profile 및 특징 167
Fig. 4-5. 미국의 주요 5가지 주행 모드 속도 Profile 및 특징 168
Fig. 4-6. JC08 주행 모드 속도 Profile 및 특징 169
Fig. 4-7. 주요도시별 PM10, PM2.5 농도 현황 170
Fig. 4-8. 국내 유종별 자동차 등록현황 및 비중 170
Fig. 4-9. 연도별 국내 휘발유 자동차 판매 및 GDI 자동차 판매대수 171
Fig. 4-10. 업체별 GDI 자동차 점유율 및 판매율 171
Fig. 4-11. Historical market share of GDI engines in the EU 172
Fig. 4-12. Historical and projected market share of GDI engines in the US 172
Fig. 4-13. GDI 자동차에서의 PM 및 PN 배출량 173
Fig. 4-14. 연도별 경유 차량과 DPF 부착 차량 174
Fig. 4-15. 연도별 누적 경유 차량과 DPF 부착 차량 174
Fig. 4-16. Gasoline particulate filter(GPF) 구조 175
Fig. 4-17. Add-on type GPF 여부에 따른 PN 배출량 비교 177
Fig, 4-18. 차세대 Add-on type GPF의 개발 Concept 및 저감효율 177
Fig. 4-19. Emission optimized 과 Back-pressure optimized 방식 GPF에서의 PN 배출량 비교 178
Fig. 4-20. Emission optimized 과 Back-pressure optimized 방식 GPF에서의 가스상배출물 비교 178
Fig. 4-21. 시험 장치 및 개략도 180
Fig. 4-22. CPC 에서의 PN 측정 방법 및 PM 측정 개략도 181
Fig. 4-23. EEPS 장치 및 제원 181
Fig. 4-24. EEPS 장치에서의 유효 Density 및 PM 환산법 182
Fig. 4-25. 시험 주행모드 속도 Profile 185
Fig. 4-26. 일반주행모드(a)와 정속주행모드(b)에서의 규제 미세입자의 PM 결과 비교 186
Fig. 4-27. 일반주행모드(위)와 정속주행모드(아래)에서의 규제 미세입자의 PN 결과 비교 188
Fig. 4-28. 일반주행모드에서의 극미세입자의 PN total concentration 및 PM 결과 비교 189
Fig. 4-29. 속도별 정속모드에서의 직경에 대한 극미세입자 분포 189
Fig. 4-30. CVS-75 모드에서의 실시간 PN concentration 배출 및 구간별 배출결과 191
Fig. 4-31. NEDC 모드에서의 실시간 PN concentration 배출 및 구간별 배출결과 192
Fig. 4-32. NIER 6, NIER 9에서의 실시간 PN concentration 배출 193
Fig. 4-33. NEDC 모드에서의 구간별 직경에 대한 극미세입자 분포 194
Fig. 4-34. NEDC 모드의 Urban 구간에서 배출되는 극미세입자 배출경향 195
Fig. 4-35. CVS-75(위)와 NEDC(아래) 모드에서의 Cold 구간 지속시간 비교 196
Fig. 4-36. CVS-75 모드에서의 주행 운전상태 별 직경에 대한 극미세입자 분포 197
Fig. 4-37. NEDC 모드에서의 주행 운전상태 별 직경에 대한 극미세입자 분포 197
Fig. 4-38. NIER 6 모드에서의 주행 운전상태 별 직경에 대한 극미세입자 분포 198
Fig. 4-39. NIER 9 모드에서의 주행 운전상태 별 직경에 대한 극미세입자 분포 198
*표시는 필수 입력사항입니다.
| 전화번호 |
|---|
| 기사명 | 저자명 | 페이지 | 원문 | 기사목차 |
|---|
| 번호 | 발행일자 | 권호명 | 제본정보 | 자료실 | 원문 | 신청 페이지 |
|---|
도서위치안내: / 서가번호:

우편복사 목록담기를 완료하였습니다.
*표시는 필수 입력사항입니다.
저장 되었습니다.
