 http://library.me.go.kr/search/DetailView.Popup.ax?sid=4&cid=5582493


권호기사보기
| 기사명 | 저자명 | 페이지 | 원문 | 기사목차 |
|---|
| 대표형(전거형, Authority) | 생물정보 | 이형(異形, Variant) | 소속 | 직위 | 직업 | 활동분야 | 주기 | 서지 | |
|---|---|---|---|---|---|---|---|---|---|
| 연구/단체명을 입력해주세요. | |||||||||
|
|
|
|
|
|
* 주제를 선택하시면 검색 상세로 이동합니다.
표제지
목차
제출문 2
요약문 3
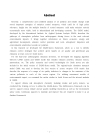
Abstract 4
Ⅰ. 서론 15
1장. 연구 배경 및 필요성 15
Ⅱ. 연구내용 및 방법 18
1장. 과업의 범위 18
2장. 연구 추진체계 및 연구진 구성 20
1절. 연구 추진 체계 20
2절. 연구원 구성표 22
Ⅲ. GAINS-Korea framework 설계 23
1장. 지역 구분, 연도, 배출원 구분 등에 대한 설계 및 이에 대한 모형 기본 틀 개발 23
1절. 지역 구분 및 모델링 연도 23
2장. GAINS-Korea의 프레임워크에 필요한 국내외 자료 요구사항 조사 및 데이터 구조 연동방법 개발 24
1절. 기준 연도 및 과거 기본 활동도 자료의 연동 24
2절. 기본 활동도 전망자료의 요구사항 및 데이터 구조 연동 위한 지자체 할당(downscaling) 방법 69
Ⅳ. 기후-대기 통합관리 모형(GAINS)을 국내 감축정책에 활용하기 위한 기반 구축 및 모듈별 초기 모형 개발 104
1장. GAINS 모형에 적합한 우리나라의 배출입력자료 및 정책/기술자료 구축 104
1절. 배출원별, 지역별 국내 배출활동도 및 배출계수의 1차 GAINS 배출 데이터베이스화 104
2절. 국ㆍ내외 동시저감 정책ㆍ기술 자료 수집/분석 및 1차 GAINS 데이터베이스화 134
3절. 국제기구 한국 전망자료 수집 및 GAINS-Korea의 데이터 구조로 전환 (IIASA) 159
2장. GAINS-Korea 배출모듈 시나리오 분석모드 기초 모형 개발 (IIASA) 162
3장. 기후 및 대기 환경 영향 산정을 위한 GAINS 이동 영향 모듈 분석 164
1절. 배출원-착지점(Source-Receptor) 관계 산정 연구 164
2절. GAINS의 대기모형기반 S-R 이동매트릭스 분석 및 운영기술 확보 165
3절. 우리나라에 특화된 S-R 이동매트릭스 작성을 위한 모델링 요구사항 분석 172
4장. 대기 확산 모형 결과를 활용한 S-R 이동매트릭스 일차 개발 178
1절. 기준연도 대기확산모델링 프레임워크 작성 178
2절. 우리나라 도메인 영역에 대한 S-R 이동 매트릭스 시험 개발 182
5장. GAINS의 기후 및 환경 피해 산정 모듈 활용을 위한 기반정보 분석 197
1절. 기온 상승 및 인체-환경 피해 산출을 위한 GAINS 피해 모듈 분석 197
2절. 우리나라 기반의 기온 상승 및 인체-환경 피해영향 기존 연구 조사 200
3절. 우리나라에 특화된 기온 상승 및 인체-환경 피해영향 연구를 위한 요구사항 분석 203
Ⅴ. GAINS의 활용을 위한 담당자 교육/훈련 제공 204
1장. 기존 GAINS 모형에 대한 일반교육 제공 204
2장. GAINS-Korea 프레임워크의 공동 설계 및 구현 207
Ⅵ. 결론 209
Ⅶ. 기대성과 및 향후계획 212
Ⅷ. 참고문헌 213
Ⅸ. 부록 216
Fig. 2-1. Research cooperation system for GAINS-Korea project 21
Fig. 2-2. Schema of GAINS-Korea framework for the first year of research project 21
Fig. 3-1. Flowchart of GAINS-Korea to build baseyear emissions 25
Fig. 3-2. Flowchart of mapping process for Powerplant sector between CAPSS and GAINS-Korea 27
Fig. 3-3. Flowchart of mapping process for Domestic sector between CAPSS and GAINS-Korea 29
Fig. 3-4. Flowchart of mapping process for Industry sector between CAPSS and GAINS-Korea 32
Fig. 3-5. Flowchart of mapping process for mobile sector between CAPSS and GAINS-Korea 35
Fig. 3-6. Flowchart of mapping process for industry process sector between CAPSS and GAINS-Korea 39
Fig. 3-7. Flowchart of mapping process for VOC sector between CAPSS and GAINS-Korea 42
Fig. 3-8. Flowchart of mapping process for Agriculture sector between CAPSS and GAINS-Korea 44
Fig. 3-9. Surrogate to allocate emissions in Sejong city 48
Fig. 3-10. Emissions ratio of industrial combustion in CAPSS by GAINS sector 49
Fig. 3-11. CAPSS to GAINS allocation surrogate for industrial combustion boilers 50
Fig. 3-12. Flowchart to calculate activities and other inputs for Powerplant, Industry and Domestic sectors 55
Fig. 3-13. Flowchart to calculate activities and other input data for On-road mobile sector 61
Fig. 3-14. Flowchart to calculate activities and other input data for Non-road mobile sectors 64
Fig. 3-15. Flowchart to calculate activities and other input data of other sectors for GAINS-Korea 68
Fig. 3-16. 국내 대도시별 생산가능인구당 GRDP 추이 (1985-2010) 70
Fig. 3-17. 광역도의 생산가능인구당 GRDP 추이 (1985-2010) 71
Fig. 3-18. 국내 대도시별 GRDP 에너지 원단위 추이 (1990-2010) 75
Fig. 3-19. 광역도의 GRDP 에너지 원단위 추이 (1990-2010) 75
Fig. 3-20. 지자체별 에너지믹스 계산 문제의 구조 79
Fig. 3-21. 기준연도와 모델링 연도의 지자체 연료 비율 행렬 80
Fig. 3-22. 특별시ㆍ광역시의 일인당 에너지소비량 추이 (1990-2010) 84
Fig. 3-23. 광역도의 일인당 에너지소비량 추이 (1990-2010) 84
Fig. 3-24. 특별시ㆍ광역시의 자동차 대당 인구수 추이 (1990-2010) 90
Fig. 3-25. 광역도의 자동차 대당 인구수 추이 (1990-2010) 90
Fig. 3-26. 특별시ㆍ광역시의 자동차 대당 휘발유 소비 추이 (1990-2010) 93
Fig. 3-27. 광역도의 자동차 대당 휘발유 소비 추이 (1990-2010) 93
Fig. 3-28. 특별시ㆍ광역시의 자동차 대당 경유 소비 추이 (1994-2010) 95
Fig. 3-29. 광역도의 자동차 대당 경유 소비 추이 (1994-2010) 96
Fig. 4-1. Energy consumption of Power plant sector of GAINS-Korea for the base year (2010) 105
Fig. 4-2. Energy consumption of Industry sector of GAINS-Korea for the base year (2010) 108
Fig. 4-3. Energy consumption of Domestic sector of GAINS-Korea for the base year (2010) 111
Fig. 4-4. Energy consumption of Road transportation sector of GAINS-Korea for the base year (2010) 114
Fig. 4-5. Energy consumption of Non-road transportation sector of GAINS-Korea for the base year (2010) 117
Fig. 4-6. Energy consumption of Industry process sector of GAINS-Korea for the base year (2010) 119
Fig. 4-7. Energy consumption of VOC sector of GAINS-Korea for the base year (2010) 121
Fig. 4-8. Energy consumption of Agriculture sector of GAINS-Korea for the base year (2010) 122
Fig. 4-9. Comparison of energy consumption between GAINS-Korea and Energy statistics 123
Fig. 4-10. Comparison of regional energy consumption between CAPSS and Energy statistics 124
Fig. 4-11. Comparison of energy consumption by regions and sectors between Energy Statistics and CAPSS 125
Fig. 4-12. Comparison of CO emissions classified by GAINS-Korea sectors between CAPSS and GAINS-Korea 129
Fig. 4-13. Comparison of NOx emissions classified by GAINS-Korea sectors between CAPSS and GAINS-Korea 130
Fig. 4-14. Comparison of SO2 emissions classified by GAINS-Korea sectors between CAPSS and GAINS-Korea 131
Fig. 4-15. Comparison of TSP emissions classified by GAINS-Korea sectors between CAPSS and GAINS-Korea 132
Fig. 4-16. Comparison of VOC emissions classified by GAINS-Korea sectors between CAPSS and GAINS-Korea 133
Fig. 4-17. Comparison of NH3 emissions classified by GAINS-Korea sectors between CAPSS and GAINS-Korea 133
Fig. 4-18. A schematic diagram for policy & control technology mapping procedure with GAINS model 150
Fig. 4-19. Example of User Interface of GAINS-Korea 163
Fig. 4-20. Map of the Korean Peninsular in GAINS-Korea 163
Fig. 4-21. An example of implementation of zoom regions in the TM5 model 166
Fig. 4-22. Example of source receptor relation in GAINS-Asia model 167
Fig. 4-23. Definitions of the Source Receptor (SR) Matrices and the Blame Matrices (source : Jerzy Bartnicki, 2000) 168
Fig. 4-24. An example of S-R Matrices for PM in GAINS-China 169
Fig. 4-25. An example of S-R Matrices for ozone in GAINS-China 170
Fig. 4-26. Definition of S. Korea administrative boundaries in GAINS model 172
Fig. 4-27. Definition of S. Korea 1st level administrative boundaries in this study 173
Fig. 4-28. Spatial distribution of modeling domains in this study 174
Fig. 4-29. Example of CMAQ/OPTM results(plot) 176
Fig. 4-30. Example of CMAQ/OPTM results(contribution) 176
Fig. 4-31. Example of source-receptor relationship for ozone during July 2009 177
Fig. 4-32. Example of spatial distribution of PEC and NO emissions from SMOKE-Asia modeling system 180
Fig. 4-33. Schematic diagram of the CAMx modeling system 182
Fig. 4-34. Spatial definition of source-Receptor region by gridded domain 183
Fig. 4-35. CAMx simulated concentrations from anthropogenic emissions to monthly average PM2.5 for Jan. 2005. (left panel: D1-54km domain, right panel : D2-18km domain) 184
Fig. 4-36. Contribution to monthly average PM2.5 concentrations from outside of S. Korea emissions for Jan. 2005 185
Fig. 4-37. Contribution to monthly average PM2.5 concentrations from large cities & Jeju emission for Jan. 2005 186
Fig. 4-38. Contribution to monthly average PM2.5 concentrations from provinces (Do) emission for Jan. 2005 188
Fig. 4-39. Scatter plot of monthly average PM10 for comparison between model estimated concentrations (MOD) and observation results (OBS) in each measurement stations 189
Fig. 4-40. Comparison of regional averaged and monthly averaged PM10 concentrations between model estimated (MOD) and observed (OBS) results for each regions 190
Fig. 4-41. Contributions from each representative countries to monthly average PM2.5 concentrations over South Korea during Jan. 2005 191
Fig. 4-42. Contributions to monthly average PM2.5 concentrations for each receptor region in South Korea during Jan. 2005 192
Fig. 4-43. Contributions from inside of South Korea regions to monthly average PM2.5 concentrations for each receptor region during Jan. 2005 193
Fig. 4-44. Contributions of fugitive dust from inside of South Korea regions to monthly average PM2.5 concentrations for each receptor region during Jan. 2005 194
Fig. 4-45. First version of PM2.5 S-R matrix for GAINS-Korea 195
Fig. 4-46. Example of PM2.5 concentrations over South Korea derived from GAINS-Korea model for the year 2005 196
Fig. 4-47. C-CHAMP의 과제 구성 201
Fig. 4-48. C-CHAMP의 구현 화면 202
Fig. 5-1. Example of register and login on GAINS model 205
Fig. 5-2. Example of display emissions on GAINS model 205
Fig. 5-3. Example of manage emission scenarios to create new scenario on GAINS model 206
Fig. 5-4. Example of main page for GAINS-Korea 207
*표시는 필수 입력사항입니다.
| 전화번호 |
|---|
| 기사명 | 저자명 | 페이지 | 원문 | 기사목차 |
|---|
| 번호 | 발행일자 | 권호명 | 제본정보 | 자료실 | 원문 | 신청 페이지 |
|---|
도서위치안내: / 서가번호:

우편복사 목록담기를 완료하였습니다.
*표시는 필수 입력사항입니다.
저장 되었습니다.
