
 대표어
대표어


권호기사보기
| 기사명 | 저자명 | 페이지 | 원문 | 기사목차 |
|---|
결과 내 검색
동의어 포함
표제지
연구원
목차
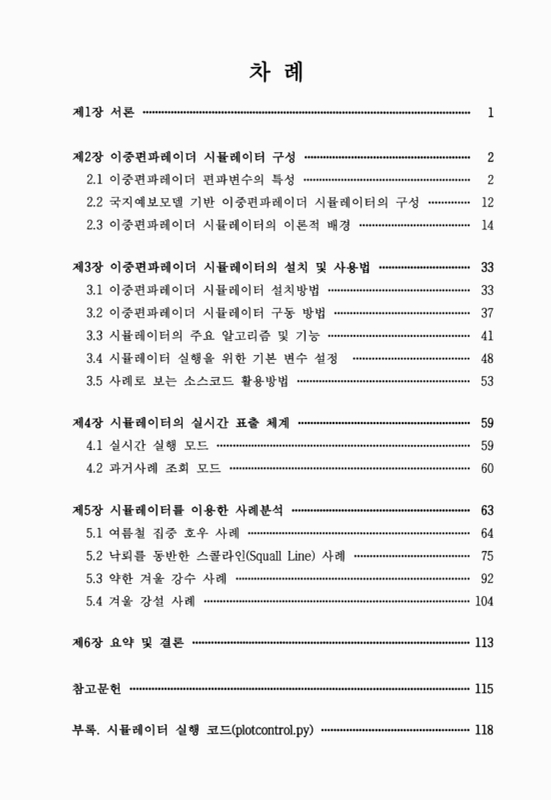
제1장 서론 10
제2장 이중편파레이더 시뮬레이터 구성 11
2.1. 이중편파레이더 편파변수의 특성 11
1) 반사도(Reflectivity, Z) 12
2) 차등반사도(Differential Reflectivity, ZDR) 13
3) 비차등위상차(Specific Differential PhaseDP)와 차등위상차(Differential Phase) 15
4) 교차상관계수(Co-Polar 혹은 Cross Correlation Coefficient, ρhv) 18
2.2. 국지예보모델 기반 이중편파레이더 시뮬레이터의 구성 21
2.3. 이중편파레이더 시뮬레이터의 이론적 배경 23
2.3.1. 대기수상체의 입자특성 모델링 23
2.2.4. 얼음 융해 모델 24
2.2.5. 국지예보모델의 미세물리 구조 27
2.2.6. 온도기반 녹는 층(Melting Layer) 모델 기능 개선 32
2.2.7. 얼음과 빙정입자의 산출 방법 개선 35
2.2.8. 위험 기상 트랙킹 모듈 40
제3장 이중편파레이더 시뮬레이터의 설치 및 사용법 42
3.1. 이중편파레이더 시뮬레이터 설치방법 42
3.1.1. 슈퍼컴 4호기에 이중편파레이더 시뮬레이터 설치 환경 42
3.1.2. 이중편파레이더 시뮬레이터 설치 순서 44
3.2. 이중편파레이더 시뮬레이터 구동 방법 46
1) 시뮬레이터 실행하기 46
2) 국지예보모델 예측장 자료 47
3.3. 시뮬레이터의 주요 알고리즘 및 기능 50
1) 주요 알고리즘 및 기능 50
2) 그 외 알고리즘 56
3.4. 시뮬레이터 실행을 위한 기본 변수 설정 57
① 모의 시간 설정 57
② 편파변수 생성 방식 결정 58
③ 출력 도메인 영역 설정 59
3.5. 사례로 보는 소스코드 활용방법 62
① 특정 레이더 고도각에서의 모의 62
② 위험기상 이동 궤적 모의 64
③ 특정 모델 고도에서의 시뮬레이션 65
④ xz 방향 단면에서의 시뮬레이션 66
⑤ yz 방향 단면에서의 시뮬레이션 67
제4장 시뮬레이터의 실시간 표출 체계 68
4.1. 실시간 실행 모드 68
4.2. 과거사례 조회 모드 69
제5장 시뮬레이터를 이용한 사례분석 72
5.1. 여름철 집중 호우 사례 73
5.1.1. 2014년 8월 21일 집중호우 73
5.1.2. 강수시스템 모의결과 74
5.1.3. 강수입자 특성 모의결과 76
5.1.4. 백령도 및 용인테스트베드 레이더 관측 자료와의 비교 78
5.1.5. 요약 83
5.2. 낙뢰를 동반한 스콜라인(Squall Line) 사례 84
5.2.1. 2015년 4월 2일의 종관 기상 84
5.2.2. 스콜라인 시스템 모의 결과 86
5.2.3. 스콜라인 시스템의 물리적 특성 모의 결과 88
5.2.4. 편파변수 모의 결과 93
5.2.5. 요약 100
5.3. 약한 겨울 강수 사례 101
5.3.1. 2015년1월25일의 종관기상 101
5.3.2. 녹는 층(밝은 띠) 산출 방법별 시뮬레이터 모의 결과 102
5.3. 입자 변수 모의 결과 111
5.3.3. 요약 112
5.4. 겨울 강설 사례 113
5.4.1. 2015년 11월 26일의 서부 내륙 강설 113
5.4.2. 적운열과 하층 저기압 대류의 시뮬레이터 모의 결과 114
5.4.3. 요약 121
제6장 요약 및 결론 122
참고문헌 124
부록. 시뮬레이터 실행 코드(plotcontrol.py) 127
기상레이더센터 기술노트 발행목록 139
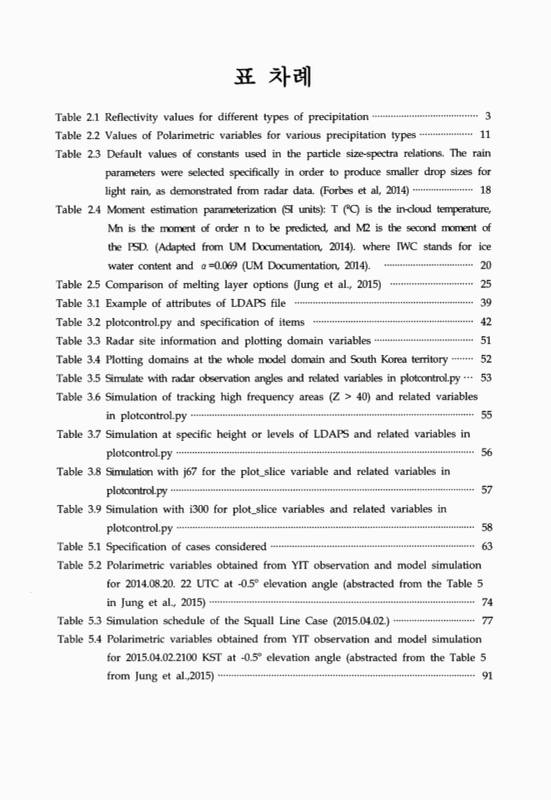
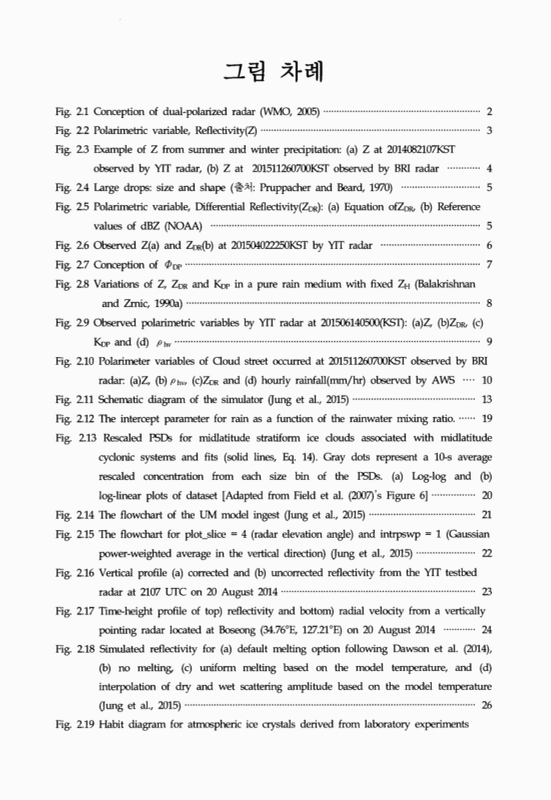
Fig. 2.1. Conception of dual-polarized radar(WMO, 2005) 11
Fig. 2.2. Polarimetric variable, Reflectivity(Z) 12
Fig. 2.3. Example of Z from summer and winter precipitation : (a)Z at 2014082107KST... 13
Fig. 2.4. Large drops : size and shape 14
Fig. 2.5. Polarimetric variable, Differential Reflectivity(ZDR): (a) Equation ofZDR, (b)...(이미지참조) 14
Fig. 2.6. Observed Z(a) and ZDR(b) at 201504022250KST by YIT radar(이미지참조) 15
Fig. 2.7. Conception of ΦDP(이미지참조) 16
Fig. 2.8. Variations of Z, ZDR and KDP in a pure rain medium...(이미지참조) 17
Fig. 2.9. Observed polarimetric variables by YIT radar at 201506140500(KST): (a)Z,... 18
Fig. 2.10. Polarimeter variables of Cloud street occurred at 201511260700KST... 19
Fig. 2.11. Schematic diagram of the simulator (Jung et al., 2015) 22
Fig. 2.12. The intercept parameter for rain as a... 28
Fig. 2.13. Rescaled PSDs for midlatitude stratiform ice clouds associated with... 29
Fig. 2.14. The flowchart of the UM model ingest (Jung et al., 2015) 30
Fig. 2.15. The flowchart for plot_slice = 4 (radar elevation angle) and intrpswp = 1... 31
Fig. 2.16. Vertical profile (a)corrected and (b)uncorrected reflectivity from the YIT... 32
Fig. 2.17. Time-height profile of top) reflectivity and bottom) radial velocity... 33
Fig. 2.18. Simulated reflectivity for (a)default melting option following Dawson et... 35
Fig. 2.19. Habit diagram for atmospheric ice crystals derived from laboratory... 36
Fig. 2.20. The vertical cross section of simulated reflectivity (dBZ)... 37
Fig. 2.21. Simulated a)ZH (dBZ), b)ZDR (dB), c)KDP (Ωkm-1) and d) ρhv for the...(이미지참조) 39
Fig. 2.22. As in Fig. 2.21. but with the new ice scattering calculation: a)ZH (dBZ), b)ZDR...(이미지참조) 40
Fig. 2.23. Swath of a) Z (≥ 40 dBZ) and b) ZDR(≥ 1.5 dB) between 2250 and...(이미지참조) 41
Fig. 3.1. Directory structure of Simulator installed in the Supercomputer 4 42
Fig. 3.2. Source code of simulator 43
Fig. 3.3. List of libraries and modules required to install the Simulator 43
Fig. 3.4. Activated modules to run the simulator 44
Fig. 3.5. Installation processes 44
Fig. 3.6. Execution of the Simulator 46
Fig. 3.7. Directories where the Simulator outcomes will be saved 47
Fig. 3.8. LDAPS Domain(a) and Flexible grid system(b)... 47
Fig. 3.9. Variable: plot_slice and its values 58
Fig. 3.10. Example of outcomes with different values for the variable,... 59
Fig. 3.11. Example of plotting domains: Radar site information, whole... 59
Fig. 3.12. Plotting domain for each radar site: (a) YIT,... 60
Fig. 3.13. Simulation at different observation angles 0.19º, 0.48º, 1.75º of the... 63
Fig. 3.14. Tracking simulation for greater than... 64
Fig. 4.1. Initial page of the dual-polarised radar simulator 69
Fig. 4.2. Initial page of the 'Query' tab in the real-time simulator web-page 70
Fig. 4.3. Example of query results in the real-time simulator web-page 70
Fig. 4.4. Users can add comments on the simulated results through the query mode 71
Fig. 4.5. Log file and job status 71
Fig. 5.1. 2014.08.21.07KST (a)CAPPI image, (b)Weather chart, (c)LDAPS hourly... 73
Fig. 5.2. 2014.08.21.07KST (a)observed hourly rainfall intensity, (b)simulated reflectivity... 74
Fig. 5.3. Simulated vertical profiles of the (a) and (b) on the figure (c) and (d)... 75
Fig. 5.4. Skew T diagram of Osan at 2014.08.21.09 KST 76
Fig. 5.5. Particle Size Distribution at different levels of LDAPS and simulated ZDR at...(이미지참조) 77
Fig. 5.6. Comparison of BRI and Simulated (a & a-1) ZH (dBZ) and (b & b-1) ZDR...(이미지참조) 79
Fig. 5.7. Comparison of YIT and Simulated (a & a-1) ZH (dBZ) and (b & b-1) ZDR...(이미지참조) 80
Fig. 5.8. Comparison of YIT and Simulated (a & a-1) ZH (dBZ) and (b & b-1) ZDR...(이미지참조) 81
Fig. 5.9. Model a)Ntr, b)LWC, and c) D0r at 20 August 2014 2200 UTC compared with... 82
Fig. 5.10. KMA's Cloud Satellite Image Analysis at 2015.04.02.21 KST 84
Fig. 5.11. Squall line occurred at 2015040222 KST: (a) Radar PPI image and (b) Lightning... 85
Fig. 5.12. Squall line observed PPI radar images (top) and Simulated ZH at level...(이미지참조) 86
Fig. 5.13. Vertical profile along the squall line at 201504023300KST 87
Fig. 5.14. Simulated vertical profile along the squall line at 201504021400UTC 88
Fig. 5.15. WRC's Hydrometeor Classification(HC) using NCAR method for the YIT... 89
Fig. 5.16. Simulated Z(top) and ZDR(bottom) att different levels of the LDAPS at...(이미지참조) 90
Fig. 5.17. PSD parameters of LDAPS level 30 (approximately 3.4km in height) at... 91
Fig. 5.18. PSD parameters of LDAPS Level 40 (approximately 5.8km in height) at... 92
Fig. 5.19. Model a) Ntr, b) LWC, and c) D0r at 02 April 2015 1400 UTC compared... 93
Fig. 5.20. Observed Z at radar elevation 1.8º by YIT (a) 201504022100KST, (b)... 94
Fig. 5.21. Swath of a) Z (≥ 40 dBZ) between 2250 and 2350 KST on 2 April 2015 95
Fig. 5.22. Simulated Z by YIT (a) 201504022100KST, (b) 201504022200KST, (c)... 96
Fig. 5.23. Comparison of KDP observed by YIT and simulated at 201504022100KST,...(이미지참조) 97
Fig. 5.24. Observed ZDR (a) 2015040221KST and (c) 2015040300KST by YIT and Simulated...(이미지참조) 98
Fig. 5.25. Observed ρhv (a)2015040221KST and (c)2015040300KST by YIT and Simulated...(이미지참조) 99
Fig. 5.26. Observation and Forecast for the Light Winter Rain occurred on 25 Jan.2015:... 101
Fig. 5.27. Radar composite PPI0 rain rate in mm/hr(a) and WRC Hydrometeor... 102
Fig. 5.28. Observed and Simulated reflectivity, Z, at 201501251200UTC 103
Fig. 5.29. LDAPS particle variables at 201501251200UTC: mean mass diameter (a-rain,... 104
Fig. 5.30. Rainwater-Graupel melting fraction calculated by MF1, 3 and 4 105
Fig. 5.31. Observed and Simulated differential reflectivity, ZDR, at 201501251200UTC(이미지참조) 106
Fig. 5.32. Observed and Simulated specific differential phase shift, KDP, at...(이미지참조) 107
Fig. 5.33. Observed and Simulated cross correlation coefficient, ρhv, at 201501251200UTC(이미지참조) 109
Fig. 5.34. Observed vertical profile of ZDR(top) and ρhv(bottom) at 201501251200UTC 110
Fig. 5.35. Simulated melting layers using MF1 and MF3 at 201501251200UTC 111
Fig. 5.36. Model a)Ntr, b)LWC, and c)D0r at 25 January 2015 1100 UTC compared... 112
Fig. 5.37. Cloud streets occurred on December 26, 2015 113
Fig. 5.38. Snow habit diagram (Ukichiro, N. 1954) 114
Fig. 5.39. Observed cloud street at 201511260900KST: (a)radar PPI0 (b)AWS 1hour... 115
Fig. 5.40. Surface pressure at 201511260900KST(a) and LDAPS forecast valid at... 115
Fig. 5.41. Observed reflectivity, Z, (a-c) at BRI 0.19o elevation and Simulated Z using... 116
Fig. 5.42. Observed reflectivity, Z, (a-c) at YIT 0.19º elevation and Simulated Z using... 117
Fig. 5.43. Observed ρhv (a) and ZDR(b) at 201511252255UTC and Simulated ρhv (a-1)...(이미지참조) 118
Fig. 5.44. Observed ρhv (a) and ZDR(b) at 201511252255UTC and Simulated ρhv (a-1) and...(이미지참조) 119
Fig. 5.45. Observed reflectivity, Z(a) at JNI 0.19º elevation and Simulated Z(b) using... 120
Fig. 5.46. Observed ρhv (a) and ZDR(b) and Simulated ρhv (a-1) and ZDR(b-1) with...(이미지참조) 120
Fig. 5.47. Simulated and Observed reflectivity, Z, at 0.59º elevation of BRI radar... 121
| 등록번호 | 청구기호 | 권별정보 | 자료실 | 이용여부 |
|---|---|---|---|---|
| 0002134767 | 551.6353 -16-2 | 서울관 서고(열람신청 후 1층 대출대) | 이용가능 | |
| 0002134768 | 551.6353 -16-2 | 서울관 서고(열람신청 후 1층 대출대) | 이용가능 |
*표시는 필수 입력사항입니다.
| 전화번호 |
|---|
| 기사명 | 저자명 | 페이지 | 원문 | 기사목차 |
|---|
| 번호 | 발행일자 | 권호명 | 제본정보 | 자료실 | 원문 | 신청 페이지 |
|---|
도서위치안내: / 서가번호:

우편복사 목록담기를 완료하였습니다.
*표시는 필수 입력사항입니다.
저장 되었습니다.
