


권호기사보기
| 기사명 | 저자명 | 페이지 | 원문 | 기사목차 |
|---|
| 대표형(전거형, Authority) | 생물정보 | 이형(異形, Variant) | 소속 | 직위 | 직업 | 활동분야 | 주기 | 서지 | |
|---|---|---|---|---|---|---|---|---|---|
| 연구/단체명을 입력해주세요. | |||||||||
|
|
|
|
|
|
* 주제를 선택하시면 검색 상세로 이동합니다.
[Title Page]
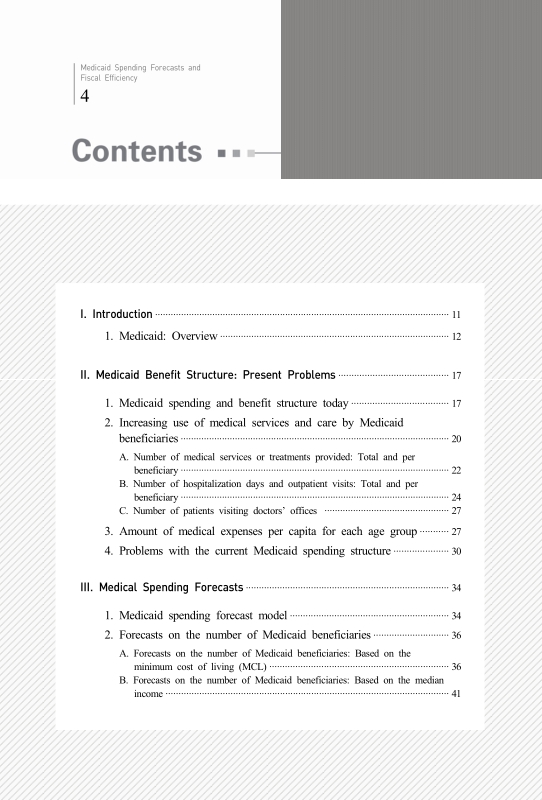
Contents
I. Introduction 11
1. Medicaid: Overview 12
II. Medicaid Benefit Structure: Present Problems 17
1. Medicaid spending and benefit structure today 17
2. Increasing use of medical services and care by Medicaid beneficiaries 20
A. Number of medical services or treatments provided: Total and per beneficiary 22
B. Number of hospitalization days and outpatient visits: Total and per beneficiary 24
C. Number of patients visiting doctors' offices 27
3. Amount of medical expenses per capita for each age group 27
4. Problems with the current Medicaid spending structure 30
III. Medical Spending Forecasts 34
1. Medicaid spending forecast model 34
2. Forecasts on the number of Medicaid beneficiaries 36
A. Forecasts on the number of Medicaid beneficiaries: Based on the minimum cost of living(MCL) 36
B. Forecasts on the number of Medicaid beneficiaries: Based on the median income 41
C. Forecasts on the number of Medicaid beneficiaries by age group 46
3. Model for forecasting Medicaid spending per capita 51
A. Forecasts on Medicaid spending per capita 51
B. Forecasts on Medicaid costs per capita for each age group 55
4. Forecasts on Medicaid spending 57
A. MCL model 57
B. Median income(MI) model 59
C. Age group model 61
IV. Conclusion 63
Bibliography 66
[Figure II-1] Trends in Medicaid Spending for Different Classes of Beneficiaries 19
[Figure II-2] Trends in Different Types of Medicaid Expenses 20
[Figure II-3] Composition of Medicaid Beneficiaries 21
[Figure II-4] Trends in the Number of Medical Services and Treatments Provided... 22
[Figure II-5] Trends in the Number of Medical Services and Treatments Provided... 23
[Figure II-6] Trends in the Ratios of Medicaid Beneficiaries Seeking Medical... 24
[Figure II-7] Trends in the Number of Hospitalization Days and Outpatient Visits... 25
[Figure II-8] Trends in the Number of Hospitalization Days and Outpatient Visits... 25
[Figure II-9] Trends in the Number of Hospitalization Days and Outpatient Visits... 26
[Figure II-10] Trends in the Number of Hospitalization Days and Outpatient Visits... 26
[Figure II-11] Trends in Medical Spending Per Capita and Age Group(2000-2012) 30
[Figure II-12] Comparison of Total Spending per Capita: NHI vs. Medicaid 31
[Figure II-13] Comparison of Benefits per Capita: NHI vs. Medicaid 31
[Figure II-14] Comparison of the Number of Hospitalization Days and Outpatient... 32
[Figure III-1] Medicaid Spending Forecast Model 35
[Figure III-2] Forecasts on the Total Number of Medicaid Beneficiaries(Based... 41
[Figure III-3] Household Income Distribution: Median Income and Average Income... 42
[Figure III-4] Trends in Median Income and Average Income(Based on Market... 42
[Figure III-5] Forecasts on the Number of Medicaid Beneficiaries(40%-MI... 46
[Figure III-6] Trends in the Age Distribution of Medicaid Beneficiaries(2000-2012) 47
[Figure III-7] Yearly Forecasts on the Number of Beneficiaries in Each Scenario 47
[Figure III-8] Yearly Trends in Medical Spending per Capita(2000-2012) 51
[Figure III-9] Monthly Trends in Medicaid Spending per Capita(January... 52
| 등록번호 | 청구기호 | 권별정보 | 자료실 | 이용여부 |
|---|---|---|---|---|
| EM0000065222 | ER Only available full-text DB | 이용가능 |
*표시는 필수 입력사항입니다.
| 전화번호 |
|---|
| 기사명 | 저자명 | 페이지 | 원문 | 기사목차 |
|---|
| 번호 | 발행일자 | 권호명 | 제본정보 | 자료실 | 원문 | 신청 페이지 |
|---|
도서위치안내: / 서가번호:

우편복사 목록담기를 완료하였습니다.
*표시는 필수 입력사항입니다.
저장 되었습니다.
