 https://documents.worldbank.org/en/publication/documents-reports/documentdetail/099021324171027344/P15674317219e001b1b53a19d592e2bdcd9


권호기사보기
| 기사명 | 저자명 | 페이지 | 원문 | 기사목차 |
|---|
| 대표형(전거형, Authority) | 생물정보 | 이형(異形, Variant) | 소속 | 직위 | 직업 | 활동분야 | 주기 | 서지 | |
|---|---|---|---|---|---|---|---|---|---|
| 연구/단체명을 입력해주세요. | |||||||||
|
|
|
|
|
|
* 주제를 선택하시면 검색 상세로 이동합니다.
Title page
Contents
Acknowledgments 10
About the Authors 12
Report Context 15
Executive Summary 17
Glossary 24
Abbreviations 27
1. Facts and Trends in Freshwater Abstraction and Produced Water Generation and Use 30
OVERVIEW 30
INTRODUCING THE ISSUE 30
OIL AND GAS IN A GLOBAL WATER DEMAND PERSPECTIVE 31
WATER USE IN UPSTREAM OIL AND GAS ACTIVITIES 32
PRODUCED WATER 34
OTHER WATER RETURNS 36
INJECTED WATER 36
WATER USE AND WATER RETURNS HEAT MAP FOR EXPLORATION AND PRODUCTION ACTIVITIES 36
NOTE 37
REFERENCES 37
2. Industry Water Management Practice in Upstream Oil and Gas Operations 39
OVERVIEW 39
COMPANY POLICY AND WATER MANAGEMENT SYSTEMS 39
INDUSTRY APPROACHES TO WATER MANAGEMENT 42
WATER USES IN UPSTREAM OPERATIONS 42
WATER EFFICIENCY MEASURES 46
PRODUCED WATER 46
INJECTED WATER FOR PRESSURE SUPPORT 47
IDENTIFICATION OF WATER SOURCES 49
TOOLS FOR WATER RISK ASSESSMENT 49
TREATMENT AND SCOPE FOR PW REUSE AND RECYCLING 51
SUMMARY OF POSSIBLE WATER USES AND ASSOCIATED QUALITY REQUIREMENTS 53
RESIDUAL WASTE MANAGEMENT 54
WATER EFFICIENCY REPORTING 55
WATER MANAGEMENT IN REFINERY OPERATIONS 55
NOTES 58
REFERENCES 59
3. Assessment of Water Sources and Supply Risks at the National Level 61
OVERVIEW 61
BROADER WATER MANAGEMENT CONTEXT 62
HYDROLOGICAL PROCESSES AND GROUNDWATER 62
INSTITUTIONAL FUNCTIONS AND LEGAL FRAMEWORK 66
ESIA PROCESS 66
RISK ANALYSIS 67
NATIONAL WATER ASSESSMENT 68
REQUIRED DATA, COLLECTION, AND PROCESSING 69
WATER RESOURCE ASSESSMENT 72
WATER SUPPLY RISKS 75
BUILDING BLOCKS OF WATER MANAGEMENT AND GOVERNANCE 76
CONCLUDING OBSERVATIONS 77
REFERENCES 78
4. Water Treatment Technologies and Their Possible Impact on Water Management Options 80
OVERVIEW 80
WATER TREATMENT INTRODUCTION 80
WATER TREATMENT REQUIREMENTS FOR INTERNAL USE OF WATER BY OIL AND GAS COMPANIES 82
WATER TREATMENT REQUIREMENTS FOR EXTERNAL USE OF WATER BY OIL AND GAS COMPANIES 89
REDUCING FRESHWATER EXTRACTION 95
CONCERNS WITH EXTERNAL USE OF PW 97
TREATMENT TECHNOLOGY POSSIBILITIES FOR EXTERNAL USE 99
CONCLUDING OBSERVATIONS 105
NOTES 106
REFERENCES 106
5. Legal, Regulatory, and Contractual Framework for Water Management 110
OVERVIEW 110
REGULATORY AND CONTRACTUAL REGIME FOR PETROLEUM OPERATIONS 110
LEGAL AND REGULATORY FRAMEWORK FOR WATER MANAGEMENT 117
FRESHWATER AND PW MANAGEMENT IN SELECTED COUNTRIES 120
IWRM 134
LESSONS LEARNED 139
NOTES 140
REFERENCES 141
6. Leading Industry Practices Illustrated by Case Studies 144
OVERVIEW 144
CASE STUDIES OVERVIEW 144
PETROBRAS (BRAZIL): WATER SOURCE ASSESSMENT AND WATER RISK ESTABLISHMENT 148
PETRONAS (MALAYSIA): BUSINESS CONTINUITY IN WATER-STRESSED CONDITIONS 151
SAUDI ARAMCO (KINGDOM OF SAUDI ARABIA): USE OF TSE IN COOLING SYSTEMS 153
ENI (ITALY): ENI REWIND BLUE WATER TECHNOLOGY AND ITS APPLICATION 158
PETROBRAS (BRAZIL): INTERNAL REUSE OF PW 168
ECOPETROL (COLOMBIA): REUSE OF PW IN AGROFORESTRY AND LIVESTOCK ACTIVITIES 170
PDO (OMAN): REEDBED TREATMENT OF PW AND REUSE FOR IRRIGATION PURPOSES 175
SAUDI ARAMCO (KINGDOM OF SAUDI ARABIA): TREATMENT OF SALINE PW WITH BROAD REUSE POTENTIAL 179
NOTES 187
REFERENCES 187
7. Policy Guidelines for Regulating Water Management in Petroleum Upstream Operations 189
OVERVIEW 189
NATIONAL WATER RESOURCE MANAGEMENT FRAMEWORK 189
OIL AND GAS SECTOR FRAMEWORK 193
WELL DRILLING: FROM EXPLORATION TO COMMERCIAL DISCOVERY 198
PfDO 199
FRESHWATER USE AND WATER RETURNS IN OIL AND GAS OPERATIONS 202
PRODUCED WATER 205
CROSS-CUTTING ISSUES 209
NOTE 213
REFERENCES 213
APPENDIX A. Water Management in New South Wales, Australia 215
APPENDIX B. Integrated Water Resources Management 222
FIGURE ES.1. Structure and key components of policy guidelines for water management 19
FIGURE 1.1. Global water demand by sector, 2014-40 32
FIGURE 1.2. Freshwater consumption in power generation and primary energy production 32
FIGURE 1.3. Range of water use for key upstream operations 33
FIGURE 1.4. Total volume of oil, gas, and PW from the approximately 1 million operating oil and gas wells in the United States 34
FIGURE 1.5. Distribution of reuse and disposal of PW in the United States 35
FIGURE 1.6. Typical oil and water production profile and volume of injected water during the life of a conventional oil field 36
FIGURE 1.7. Heat map of water-using activities and return flows in oil and gas upstream operations 37
FIGURE 2.1. Typical elements of a health, safety, and environment management system 40
FIGURE 2.2. Schematic of mud and cuttings treatment and disposal 44
FIGURE 2.3. Schematic of produced water use in conventional oil production 45
FIGURE 2.4. Typical water profile over the life cycle of an oil and gas field 50
FIGURE 3.1. Food-energy-water nexus 62
FIGURE 3.2. Hydrological cycle 63
FIGURE 3.3. Distribution of freshwater resources 64
FIGURE 3.4. Schematic of subsurface water system in unconfined and confined aquifers 65
FIGURE 3.5. Steps of the ESIA process 67
FIGURE 3.6. Example of a river basin and groundwater model 72
FIGURE 3.7. Multiple dimensions of water management and governance 77
FIGURE 4.1. Typical water source and application schematic for treating PW in upstream operations 81
FIGURE 4.2. Typical seawater treatment line-up 84
FIGURE 4.3. Typical PW treatment line-up for PW reinjection 85
FIGURE 4.4. Typical PW treatment line-up for chemical EOR 86
FIGURE 4.5. Typical PW treatment line-up for thermal EOR 86
FIGURE 4.6. Horizontal drilling in oil- and gas-rich shale 87
FIGURE 4.7. Typical produced water treatment line-up for unconventional operations 88
FIGURE 4.8. Removal steps for use of seawater and PW in oil and gas operations 88
FIGURE 4.9. Fit-for-purpose reuse evaluation process 89
FIGURE 4.10. Possible uses of produced water 90
FIGURE 4.11. Estimated resource range in wastewater from unconventional oil and gas formations in the United States 94
FIGURE 4.12. Distribution of Earth's water 95
FIGURE 4.13. OSPAR convention's risk-based approach for discharging produced water overboard 98
FIGURE 4.14. Treatment technologies for PW 100
FIGURE 4.15. Total cost of schemes used in produced water treatment (including membranes) 101
FIGURE 4.16. Example of water treatment for municipal use in Cape Verde 103
FIGURE 4.17. Technologies tested for PDO's Nimr Water Treatment Plant 104
FIGURE 5.1. Scope of components of the petroleum regime 112
FIGURE 5.2. Typical government functions and institutional structure for petroleum sector management 114
FIGURE 5.3. Upstream oil and gas activities and associated environment and water assessments 115
FIGURE 6.1. WSRI subindexes and categories or risk levels 150
FIGURE 6.2. COC of the cooling system operating with TSE 157
FIGURE 6.3. Block flow diagram of the pilot plant 163
FIGURE 6.4. Blue Water Plant general layout (project under permitting procedure) 167
FIGURE 6.5. Cross-section of the reedbed at the NWTP 177
FIGURE 6.6. PW reuse: process schematic 180
FIGURE 6.7. Technology readiness levels 181
FIGURE 6.8. Pretreatment (de-oiling) and desalination schematic for PW reuse 182
FIGURE 6.9. PW desalination: membranes 183
FIGURE 6.10. PW desalination: membranes process scheme 183
FIGURE 6.11. PW desalination: high salinity (〈150,000 mg/l) 184
FIGURE 6.12. PW desalination: mechanical vapor compression process schematic 185
FIGURE 6.13. PW desalination: mechanical vapor compression principle 185
FIGURE 6.14. PW reuse: water circularity 186
FIGURE 7.1. Structure and key components of policy guidelines for water management 190
FIGURE 7.2. Main steps in the PfDO process 199
FIGURE 7.3. Main steps in the ESIA process 202
FIGURE 7.4. Example of water-to-oil ratio toward the end of a conventional oil field's production life 205
Boxes
BOX 2.1. Key elements of IPIECA's water management framework 40
BOX 2.2. Facts on water in hydrocarbon reservoirs 48
BOX 2.3. Eni's approach to assessing water risk 50
BOX 2.4. Excerpts from the Carbon Disclosure Project Water Security 2022 Questionnaire 56
BOX 2.5. Khartoum Refinery in Sudan 57
BOX 3.1. Key elements of an ESIA and ESIA report 68
BOX 3.2. Minimizing the surface footprint of petroleum operations 69
BOX 3.3. Examples of programs for national hydrography 70
BOX 3.4. Regional water assessment of Lake Chad Basin 73
BOX 4.1. Preserving fresh water: the Dawson Creek reclaimed water project 96
BOX 5.1. Production-sharing agreement 113
BOX 5.2. Model for petroleum and environment authorities' regulatory interaction 116
BOX 5.3. Key integrated water resource management principles 135
BOX 5.4. Insights from countries' experience with integrated water management 138
BOX 6.1. Information available in the Aqueduct Water Risk Atlas 152
BOX 6.2. Petronas's Water for Life Program 153
BOX 6.3. Key characteristics of the full-scale Blue Water Plant 165
Maps
MAP 1.1. World map of water shortage areas, expressed as the number of months in which freshwater demand exceeds water availability 31
MAP 4.1. Distribution of drylands and main oil and gas production zones in these areas 91
MAP 4.2. Desalination capacity map 103
MAP 6.1. Geographical location of case studies 145
MAP 6.2. Locations of Petrobras's upstream activities 149
MAP 6.3. Malaysia's oil and gas infrastructure 152
MAP 6.4. Location of Eni's Centro Olio Val D'Agri (COVA) 159
MAP 6.5. Location of Ecopetrol's PW for agroforestry and livestock project 171
Photos
PHOTO 2.1. Bioremediation facility with settling lagoons and engineered wetlands (Heglig, Sudan) 52
PHOTO 2.2. Well pads, central processing facility, and water treatment ponds (Palouge, South Sudan) 52
PHOTO 4.1. Miraah solar plant delivers first steam to Amal West Oil Field 87
PHOTO 6.1. Cooling tower and pilot setup at a Saudi Aramco facility 154
PHOTO 6.2. Scale deposits on condenser surface with use of groundwater 155
PHOTO 6.3. Scale deposits on condenser surface with use of TSE 157
PHOTO 6.4. Some sections of the pilot plant installed and run, 2013-14 164
PHOTO 6.5. Structure for the assembly and installation of pumps and filters in an offshore production unit that was not initially designed for PW reinjection 169
PHOTO 6.6. Change in the ASA after environmental rehabilitation, planting, and irrigation 173
PHOTO 6.7. Aerial view of the NWTP 176
PHOTO 6.8. PW desalination: membranes at field site 184
PHOTO 6.9. PW desalination: mechanical vapor compression at field site 186
Box Tables
TABLE B6.3.1. Main operation units and associated treatment sequence of the full-scale Blue Water Plant 165
TABLE B6.3.2. Main features of the Blue Water Plant 166
Box Figures
FIGURE B2.1.1. Key elements of IPIECA's water management framework 41
FIGURE B2.2.1. How water, oil, and gas fill the pore space in reservoir rock 48
FIGURE B3.2.1. Comparison of separate vertical production wells with cluster of deviated production wells 69
FIGURE B3.4.1. Illustration of Lake Chad Basin freshwater shortage concerns and the associated environmental and social impacts 74
FIGURE B5.1.1. Structure of a production-sharing contract 113
FIGURE B6.3.1. Physical design of the Blue Water Plant 166
Box Photos
PHOTO B2.5.1. Wastewater ponds at the Khartoum Refinery 58
PHOTO B4.1.1. Dawson Creek lagoon 96
FIGURE B.1. IWRM thematic areas and elements of regulation and compliance 224
Appendix Boxes
BOX A.1. Roles and responsibilities of key New South Wales agencies 216
BOX A.2. Major elements of a water-sharing plan 218
BOX A.3. Aspects specified in groundwater-sharing plans 220
BOX B.1. Key integrated water resource management principles 223

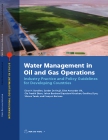
Steadily increasing demand for water poses a threat to sustainable development, and an increasing number of regions are chronically short of water. Putting caps on water consumption, increasing water use efficiencies, and supporting improved sharing of water resources are now critical to reducing the perils posed by water scarcity to biodiversity and human welfare. Although freshwater demand in oil and gas operations is a small fraction of global water demand, oil and gas fields are commonly clustered in smaller areas, where their operations often dominate freshwater
abstraction and wastewater discharge. At the same time, oil production generates large amounts of produced water that may be used to reduce freshwater abstraction and possibly serve beneficial purposes outside the petroleum sector.
In the most advanced countries, regulation promotes the sound use of freshwater in the oil and gas industry and incentivizes the reuse or beneficial use of treated produced water. Regulation is also used to prevent the contamination of freshwater resources from the disposal of unproperly
treated produced water. In many developing and emerging economies, however, regulation to prevent water contamination is often lacking or nonexistent or, when present, is poorly enforced.
Optimal policy and regulation of the use of freshwater and the reuse of water generated by oil and gas operations depend on a range of geographic, geological, technical, and economic factors. Water Management in Oil and Gas Operations: Industry Practice and Policy Guidelines for Developing Countries identifies common policy principles organized around key regulatory functions and critical links of the oil and gas value chain. This report offers practical solutions to guide policy makers and regulators seeking to minimize the environmental impacts of oil and gas perations,
to promote sustainable cross-sectoral economic linkages, and to reduce competition and potential confl icts over access to and use of water resources.
*표시는 필수 입력사항입니다.
| *전화번호 | ※ '-' 없이 휴대폰번호를 입력하세요 |
|---|
| 기사명 | 저자명 | 페이지 | 원문 | 기사목차 |
|---|
| 번호 | 발행일자 | 권호명 | 제본정보 | 자료실 | 원문 | 신청 페이지 |
|---|
도서위치안내: / 서가번호:

우편복사 목록담기를 완료하였습니다.
*표시는 필수 입력사항입니다.
저장 되었습니다.
