 https://www.wto.org/english/res_e/publications_e/climate_action_e.htm


권호기사보기
| 기사명 | 저자명 | 페이지 | 원문 | 기사목차 |
|---|
| 대표형(전거형, Authority) | 생물정보 | 이형(異形, Variant) | 소속 | 직위 | 직업 | 활동분야 | 주기 | 서지 | |
|---|---|---|---|---|---|---|---|---|---|
| 연구/단체명을 입력해주세요. | |||||||||
|
|
|
|
|
|
* 주제를 선택하시면 검색 상세로 이동합니다.
Title page
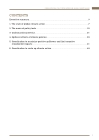
Contents
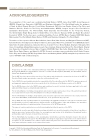
Acknowledgements 3
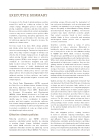
Executive summary 4
1. The state of global climate action 8
1.1. Key climate projections show gaps in both ambition and implementation to achieve the objectives of the Paris Agreement 9
1.2. Countries rely on diverse climate policy instruments with momentum building for the use of carbon pricing policies 9
1.3. Resilient low-emission development pathways deliver many benefits and can help promote economic growth, supporting the achievements of various SDGs 13
2. The menu of policy tools 16
2.1. The choice of mitigation instruments is ultimately guided by climate and non-climate goals, multiple market failures, fiscal implications, and other criteria 17
2.2. Decarbonization calls for a package of coordinated and strategically sequenced climate change policies in which carbon pricing can play a central role 18
2.3. Achieving just transitions to a low-carbon economy and maintaining political support requires additional policies 19
3. Carbon pricing metrics 22
3.1. The task force builds on existing metrics introduced by its participating international organizations, leveraging commonalities across the metrics 23
3.2. More granular data are needed to improve the accuracy and coverage of carbon pricing metrics and evaluate the international competitiveness impacts... 25
3.3. Other metrics measure the impact of carbon pricing and other policies on emissions 25
4. Spillover effects of climate policies 30
4.1. A country's climate change policies generate five generic types of cross-border spillovers on other countries with mixed effects on their economic and... 31
4.2. Cost increasing climate policies, such as carbon pricing, generate both positive and negative cross-border spillover effects, depending on their design 32
4.3. Climate policies such as carbon pricing can lead to carbon leakage, which some jurisdictions are looking to limit through the introduction of BCAs 35
4.4. Cost-decreasing climate change policies, such as subsidies to foster decarbonization, generate a mix of positive and negative cross-border spillover effects 38
5. Coordination to maximize positive spillovers and limit negative cross-border impacts 42
5.1. Enhanced international coordination among countries is essential to maximize positive cross-border spillovers and minimize negative spillovers 43
5.2. Developing a common understanding of cross-border spillovers and their impacts, including better evidence on actual leakages, helps countries better... 43
5.3. Greater alignment of carbon intensities and product-specific emission metrics or benchmarks can help reduce compliance costs for firms engaged... 44
5.4. Focused technology dissemination can accelerate the climate transition 46
5.5. Common understandings for implementation of trade-related climate measures can avoid unjustifiable discrimination, excess compliance costs,... 47
6. Coordination to scale up climate action 50
6.1. International organizations help countries raise climate action by supporting the use of climate policies 51
6.2. Modalities for international coordination mechanisms can vary and aim at closing gaps in (1) transparency, (2) implementation and (3) ambition 51
6.3. Further joint work by international organizations can help fill the knowledge gaps identified in this report 55
Table 1.1. Examples of climate mitigation policy instruments 10
Table 3.1. Overview of existing carbon pricing and climate policy impact metrics by international organization, scope, granularity, approach and methodology 28
Table 6.1. Opportunities for coordination to close the transparency, implementation, and ambition gaps 56
Figure 1.1. Policy mix by country 11
Figure 1.2. Trends of climate policy instruments 12
Figure 1.3. Map of carbon taxes and ETSs around the world 12
Figure 1.4. Global greenhouse gas emissions covered by explicit carbon pricing policies 13
Figure 1.5. Prices and coverage across explicit carbon pricing policies 14
Figure 3.1. Carbon pricing instruments and share of greenhouse gas emission by sector 24
Figure 3.2. Methodology for data collection of carbon pricing instruments and calculation and aggregation of carbon pricing metrics 26
Figure 4.1. Changes in total trade for various mitigation scenarios and country groups and the reallocation of export shares across sectors in 2050... 33
Figure 4.2. Cost increases and competitiveness effects of different climate policies 34
Figure 4.3. Top low and lower-medium income countries with the highest share of the EUDR products in total merchandise exports to the eu, by region 35
Figure 4.4. Relative carbon border adjustment mechanism exposure index 39
Boxes
Box 4.1. Steelmaking and fertilizers 40
*표시는 필수 입력사항입니다.
| *전화번호 | ※ '-' 없이 휴대폰번호를 입력하세요 |
|---|
| 기사명 | 저자명 | 페이지 | 원문 | 기사목차 |
|---|
| 번호 | 발행일자 | 권호명 | 제본정보 | 자료실 | 원문 | 신청 페이지 |
|---|
도서위치안내: / 서가번호:

우편복사 목록담기를 완료하였습니다.
*표시는 필수 입력사항입니다.
저장 되었습니다.
