 https://science.osti.gov/-/media/bes/besac/pdf/Reports/US_Domestic_High-Performance_Reactor-Based_Research_Facility.pdf?la=en&hash=291CD65F6F02D66C9C7987CB6E660831BB0E1A0B


권호기사보기
| 기사명 | 저자명 | 페이지 | 원문 | 기사목차 |
|---|
| 대표형(전거형, Authority) | 생물정보 | 이형(異形, Variant) | 소속 | 직위 | 직업 | 활동분야 | 주기 | 서지 | |
|---|---|---|---|---|---|---|---|---|---|
| 연구/단체명을 입력해주세요. | |||||||||
|
|
|
|
|
|
* 주제를 선택하시면 검색 상세로 이동합니다.
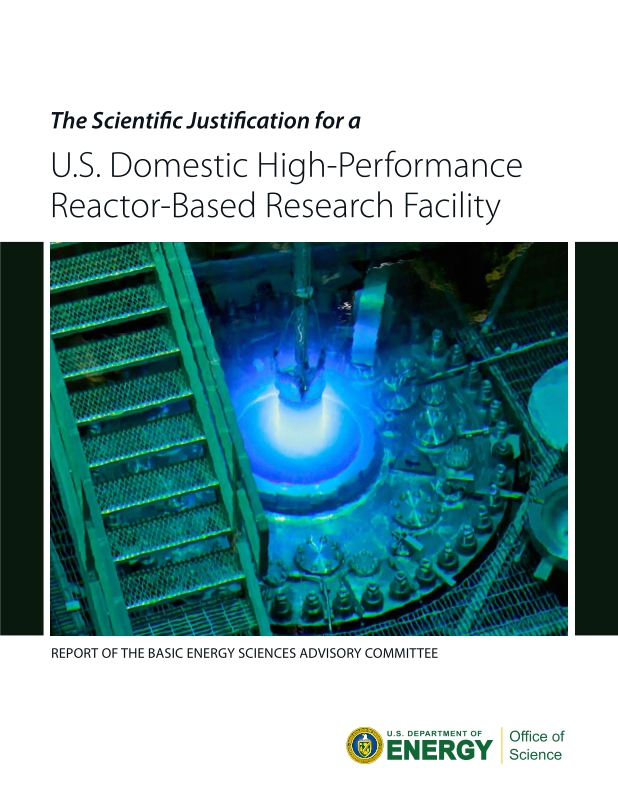
Title page
Contents
EXECUTIVE SUMMARY 9
RECOMMENDATIONS 13
INTRODUCTION 14
THE SCIENTIFIC CASE 16
1. Neutron Scattering 17
1a. Solid State Physics Including Quantum Materials 17
1b. Soft Matter 27
1c. Biology 30
1d. Polarized Neutrons 33
1e. Synchrotron X-rays vs. Neutrons 35
2. Industrial Applications of Neutron Scattering 38
2a. Industrial Applications 38
2b. Industry-Related Consortia for Use of Neutrons 39
2c. Neutron Techniques with Potential Industrial Applications 40
2d. Barriers to Broad Industry Use of Neutrons 40
2e. Summary 41
3. Fundamental Physics at Reactors and Spallation Sources 42
4. Isotope Production 49
4a. Isotope Production at HFIR 49
4b. Heavy Element Chemistry 51
5. Materials Irradiation 54
5a. Materials Irradiation - General 54
5b. Fusion Materials Irradiation 56
HEU-LEU CONVERSION 59
Preservation of Reactor Capability with Low Enriched Uranium Fuel 60
Selection of U₃Si₂ for HFIR Application, and the Path to Conversion 61
Progress on High Flux Reactor Conversion since 2016 NAS and 2018 APS Studies 62
MAJOR U.S. NEUTRON FACILITIES: STATUS AND FUTURE PLANS 64
High Flux Isotope Reactor (HFIR) 65
NIST Center for Neutron Research (NCNR) 68
SNS Present and Future 71
INTERNATIONAL NEUTRON FACILITIES 73
Institut Laue-Langevin (ILL) 74
Forschungsreaktor Munchen II (FRM-II) 76
Jules Horowitz Research Reactor (JHR) 78
Belgian Reactor 2 (BR2) 79
CONCLUSIONS 80
REFERENCES AND NOTES 85
APPENDIX 1. OAK RIDGE PROPOSED STRATEGY FOR HFIR 91
APPENDIX 2. THE GLOBAL EFFORT TO CONVERT RESEARCH REACTORS TO LOW ENRICHED URANIUM FUELS 102
APPENDIX 3. HFIR, SNS, AND NIST USER DATA 110
Figure 1a.1. High-field phase diagram of FeSe for field parallel to ab-plane. The possible FFLO state is shown in red 18
Figure 1a.2. Neutron Larmor diffraction can be used to accurately determine the temperature dependence of the lattice distortion of Ni-doped NaFeAs in the paramagnetic tetragonal phase 19
Figure 1a.3. Linewidths of transverse acoustic phonons along q = (ξ,ξ,0) in Pb 19
Figure 1a.4. Experimental (top, right panels) and calculated (top, left panels) neutron data for CrI3: the band gap at Dirac points along different cuts (bottom left) 20
Figure 1a.5. An image of the magnetic skyrmion lattice as seen by small angle neutron scattering. After forming a stable, triangular lattice of skyrmions, magnetic field can rearrange them into... 22
Figure 1a.6. The BIX-3 diffractometer, equipped with a neutron image plate, is dedicated to protein crystallography using a monochromatized neutron beam source (installed at the JAERI... 24
Figure 1a.7. Results from Refs. 69 and 70 using pulsed neutron diffraction from IPNS. These experiments were among the first to accurately determine the structure of YBa₂Cu₃O7 25
Figure 1a.8. Neutron elastic diffuse scattering intensity at an HRPP on a relaxor ferroelectric (from Ref. 73) 26
Figure 1a.9. The composition dependence of the Jahn-Teller polarons in CMR material, La₁-xSrxMnO₃ determined from pulsed neutron diffraction and the pair density function analysis from... 27
Figure 1c.1. Application space of scattering neutrons from biological materials. Applications at the intersections of basic science, materials research, and medicine are italicized 30
Figure 1d.1. Dipolar Spin-Ice State in Ho₂Ti₂O7 Haldane-like Effect in Spin-1 Pyrochlore? 34
Figure 1d.2. Wide Angle Polarization Analysis 35
Figure 1e.1. Real and momentum space lattices of several compounds. The circles surrounding zero momentum show the region of momentum space accessible to resonant inelastic X-ray... 36
Figure 3.1. Left: Fission process in a nuclear reactor. The fission products beta-decay to produce a flux of pure MeV electron antineutrinos emitted isotropically from the reactor. Right: Neutrino... 43
Figure 3.2. Left: Neutrinos are elementary particles with no charge in the Standard Model of Particle Physics. Right: The neutron is a composite particle consisting of 3 quarks held together... 44
Figure 4a.1. Cf-252 production from a 7 gram mixed curium target at different thermal neutron fluxes 50
Figure 4a.2. A comparison of W-188 production at HFIR to what can be achieved at other research/isotope production reactors 51
Figure 4b.1. Producing Trans-curium Heavy Isotopes 52
Figure 4b.2. Production of Es-254 at HFIR compared to the production that can be achieved with typical research and test reactors 53
Figure 4b.3. Isotope Production Quantities 53
Figure 5a.1. Es-254 Production from 7g Mixed Cm Target 54
Figure 5a.2. Target Basket and Example PTP Target 55
Figure 5a.3. HFIR MiniFuel Experiment System 56
Figure 5b.1. Complementarity of research reactors based on the power output. The MITR, HFIR, and ATR reactors shown above the arrow are used for neutron irradiations to study materials... 58
Figure HL.1. Timeline of the Global Reactor Conversions, 1978-2019 60
Figure HL.2. Three Group Neutron Flux Radial Profiles on Core Midplane 62
Figure US.1. HFIR Axial and Radial Cross-Sections 65
Figure US.2. Neutron Flux and Energy Across the HFIR 66
Figure US.3. HFIR Target Basket Locations 67
Figure US.4. NCNR Reactor Layout 69
Figure US.5. Neutron Beam Resources at NCNR 70
Figure US.6. The Instrumentation Layout at FTS, SNS 71
Figure US.7. Peak and time-averaged brightness of current (closed circles) and planned (open circles) neutron sources, illustrated at 5 Å. CSNS: China Spallation Neutron Source, China; ESS:... 72
Figure I.1. Floor Plan of the ILL 74
Figure I.2. Floor Plan of the FRM-II 77
Boxes
Box 1.1. Polymer Micelles 29
Box 1.2. Membrane-Associated Proteins 32
Box 1.3. Oxide Heterojunction Magnetism 37
Box 2.1. Exxon and Neutron Scattering 39
Box 3.1. High Flux Isotope Reactor - A Compact Source for Neutrino Science 43
Box 3.2. Precision Studies of Reactor Antineutrinos with PROSPECT 45
Box 3.3. Probing the Neutron Electric Dipole Moment and CP Symmetry 46
Box 3.4. First Observation of Coherent Elastic Neutrino-Nucleus Scattering of Neutrinos 47
Box Figures
Box 1.1. Polymer Micelles 29
Figure A. Time decay of scattered intensity from blends of deuterated and hydrogenated micelles 29
Box 1.3. Oxide Heterojunction Magnetism 37
Figure A. Schematic illustration of resonant X-ray diffraction from a thin film of LaNiO₃ that is only two layers thick. Frano et al. were able to demonstrate that these films order magnetically,... 37
Figure B. Resonant X-ray magnetic diffraction peak which demonstrates magnetic order in two-unit cell thick films of LaNiO₃ on LaAlO₃. Magnetism does not appear when the LaNiO₃ film... 37
Box 3.2. Precision Studies of Reactor Antineutrinos with PROSPECT 45
Figure A. Left: The PROSPECT detector inside its containment and shielding package inside HFIR next to the reactor wall. Right: Conceptual drawing of the PROSPECT detector with regards... 45
Figure B. Assembly of the segmented PROSPECT detector at the Yale Wright Laboratory prior to its shipment to ORNL/HFIR 45
Box 3.3. Probing the Neutron Electric Dipole Moment and CP Symmetry 46
Figure A. Parity (P) and time-reversal (T) violation due to an electric dipole moment 46
Figure B. Left: First measurement of the neutron electric dipole moment at the Oak Ridge Reactor in 1950. Right: Conceptual drawing of the planned nEDM experiment 46
Box 3.4. First Observation of Coherent Elastic Neutrino-Nucleus Scattering of Neutrinos 47
Figure A. Left: Coherent scattering process of neutrinos off nuclei. Right: Assembly of the CsI[Na] detector at the SNS. The CsI[Na] detector is the world's smallest working neutrino detector... 47
Figure A1.1. Photo and schematic of the HFIR core, showing the flux trap (yellow), fuel region (gray), and reflector (purple and green) 92
Figure A1.2. ORNL's High Flux Isotope Reactor (HFIR) campus including the Radiochemical Engineering Development Center (REDC) 93
Figure A1.3. Source brightness for thermal and cold neutron scattering at HFIR and ILL 94
Figure A1.4. Original Installation of the HFIR Pressure Vessel The HFIR building and pool were designed to support pressure vessel replacement 96
Figure A1.5. Early HB-2 Guide Hall Concept 97
Figure A1.6. The Upgraded HFIR Will Provide World-leading Time-averaged Brightness for Both Cold and Thermal Neutrons 100
Figure A2.1. Geography of the Global Reactor Conversions, 1978-2019 102
Figure A2.2. The Concepts of Dispersion and Monolithic Fuel Plates 105
Figure A3.1. HFIR Facility GU Days Requested and Days Delivered 110
Figure A3.2. NIST Beamtime Between January 2015-January 2020 110
Figure A3.3. 32% of HFIR Proposals Rated ≥3 Are Not Awarded Beamtime 111
Figure A3.4. Oversubscription Rate Over Time 111
Figure A3.5. Number of SNS and HFIR Users by Fiscal Year 112
Figure A3.6. HFIR Subscription Rate by Field Over Recent 5-Year Period 112
Figure A3.7. HFIR Instrument General User Proposal Metrics 113
*표시는 필수 입력사항입니다.
| *전화번호 | ※ '-' 없이 휴대폰번호를 입력하세요 |
|---|
| 기사명 | 저자명 | 페이지 | 원문 | 기사목차 |
|---|
| 번호 | 발행일자 | 권호명 | 제본정보 | 자료실 | 원문 | 신청 페이지 |
|---|
도서위치안내: / 서가번호:

우편복사 목록담기를 완료하였습니다.
*표시는 필수 입력사항입니다.
저장 되었습니다.
