 https://nces.ed.gov/pubsearch/pubsinfo.asp?pubid=2021025


권호기사보기
| 기사명 | 저자명 | 페이지 | 원문 | 기사목차 |
|---|
| 대표형(전거형, Authority) | 생물정보 | 이형(異形, Variant) | 소속 | 직위 | 직업 | 활동분야 | 주기 | 서지 | |
|---|---|---|---|---|---|---|---|---|---|
| 연구/단체명을 입력해주세요. | |||||||||
|
|
|
|
|
|
* 주제를 선택하시면 검색 상세로 이동합니다.
Title page
Contents
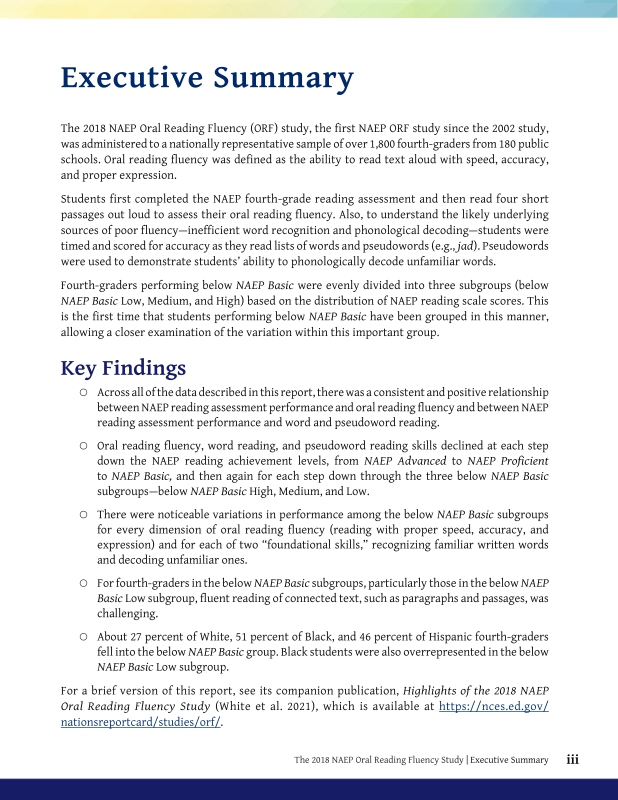
Executive Summary 4
Introduction 10
Importance of Measuring Oral Reading Fluency 11
Purpose of the 2018 NAEP ORF Study 12
Definition of Oral Reading Fluency 12
Method 14
Measures 14
Description of the Tasks 15
Study Sample and Administration of the Tasks 15
Scoring 17
Results 20
Average Oral Reading Fluency Performance and Foundational Skills 20
Average Oral Reading Fluency Performance by Demographic Subgroups: Passage Reading WCPM 20
Average Oral Reading Fluency Performance by NAEP Reading Achievement Levels: Passage Reading WCPM 25
Description of achievement levels 25
Percent distribution by NAEP reading achievement levels and selected student characteristics 26
Percent distribution by below NAEP Basic subgroup and selected student characteristics 27
Passage reading WCPM by NAEP achievement level and selected student characteristics 28
Oral Reading Fluency Performance and Foundational Skills by below NAEP Basic Subgroups 30
Estimated Number of Fourth-Grade Students Performing below NAEP Basic and in the below NAEP Basic Low Subgroup by Race/Ethnicity 39
Profile of America's Fourth-Graders Performing below NAEP Basic Low 40
Discussion 42
Passage Reading and Performance Levels 42
Passage reading: Words correct per minute (WCPM) 42
Passage reading: Rate and accuracy 42
Passage reading: Expression 43
Word-Level Reading, Performance Levels, and Race/Ethnicity 43
Limitations 45
Conclusion and Implications 46
Conclusion 46
Implications 46
The NAEP reading framework and future assessments 46
Policy and research 47
References 48
Appendix A: Technical Notes 51
Task Development Framework 51
Framework for word lists 51
Framework for pseudoword lists 51
Sampling 52
Demographic characteristics of the 2018 NAEP ORF sample 52
Treatment of missing data 53
Scaling of NAEP Reading Assessment 54
Weighting and Variance Estimation 55
Statistical Testing Procedures 55
Scoring of Passage Variables 56
Constructing below NAEP Basic Subgroups 57
Appendix B: Sample Oral Reading Passage 58
Appendix C: Estimates and Standard Errors for Tables and Figures 60
Figure 1. NAEP Oral Reading Fluency (ORF) study assessment administration procedure: 2018 16
Figure 2. NAEP Oral Reading Fluency passage reading expression rubric: 2018 19
Figure 3. Average passage reading WCPM by gender: 2018 21
Figure 4. Average passage reading WCPM by race/ethnicity: 2018 22
Figure 5. Average passage reading WCPM by National School Lunch Program (NSLP) eligibility status: 2018 23
Figure 6. Average passage reading WCPM by English language learner (ELL) status: 2018 24
Figure 7. Average passage reading WCPM by students with disabilities status: 2018 25
Figure 8. NAEP grade 4 reading achievement-level descriptions 26
Figure 9. Average passage reading WCPM by NAEP reading achievement level and below NAEP Basic subgroup: 2018 31
Figure 10. Average passage reading rate by NAEP reading achievement level and below NAEP Basic subgroup: 2018 32
Figure 11. Average passage reading accuracy by NAEP reading achievement level and below NAEP Basic subgroup: 2018 34
Figure 12. Average passage reading expression by NAEP reading achievement level and below NAEP Basic subgroup: 2018 35
Figure 13. Average word reading WCPM by NAEP reading achievement level and below NAEP Basic subgroup: 2018 37
Figure 14. Average pseudoword reading WCPM by NAEP reading achievement level and below NAEP Basic subgroup: 2018 38
Figure 15. Oral reading and foundational skill characteristics of fourth-graders performing at the below NAEP Basic Low level: 2018 41
Figure B-1. Sample oral reading passage: 2018 58
*표시는 필수 입력사항입니다.
| *전화번호 | ※ '-' 없이 휴대폰번호를 입력하세요 |
|---|
| 기사명 | 저자명 | 페이지 | 원문 | 기사목차 |
|---|
| 번호 | 발행일자 | 권호명 | 제본정보 | 자료실 | 원문 | 신청 페이지 |
|---|
도서위치안내: / 서가번호:

우편복사 목록담기를 완료하였습니다.
*표시는 필수 입력사항입니다.
저장 되었습니다.
