 https://ies.ed.gov/ncee/pubs/2024003/


권호기사보기
| 기사명 | 저자명 | 페이지 | 원문 | 기사목차 |
|---|
| 대표형(전거형, Authority) | 생물정보 | 이형(異形, Variant) | 소속 | 직위 | 직업 | 활동분야 | 주기 | 서지 | |
|---|---|---|---|---|---|---|---|---|---|
| 연구/단체명을 입력해주세요. | |||||||||
|
|
|
|
|
|
* 주제를 선택하시면 검색 상세로 이동합니다.
Title page
Contents
Evaluation Report 1
GOAL OF TARGETING FUNDING WAS NOT FULLY ACHIEVED 7
LESS FOCUS ON LITERACY PROGRAMS WITH RIGOROUS EVIDENCE THAN EXPECTED 9
INSTRUCTIONAL PRACTICES EMPHASIZED BY SRCL LESS WIDELY USED THAN EXPECTED 13
REFERENCES 23
ACKNOWLEDGMENTS 25
Appendix 26
APPENDIX A. BACKGROUND ON STRIVING READERS COMPREHENSIVE LITERACY GRANT PROGRAM 38
APPENDIX B. METHODS 58
APPENDIX C. SUPPLEMENTAL EXHIBITS AND INFORMATION ON STUDY FINDINGS 119
APPENDIX D. ADDITIONAL ANALYSES 146
APPENDIX E. EVIDENCE FOR FEATURES OF COMPREHENSIVE LITERACY INSTRUCTION 180
APPENDIX F. INDEPENDENT EVIDENCE REVIEW 187
REFERENCES 201
Exhibits
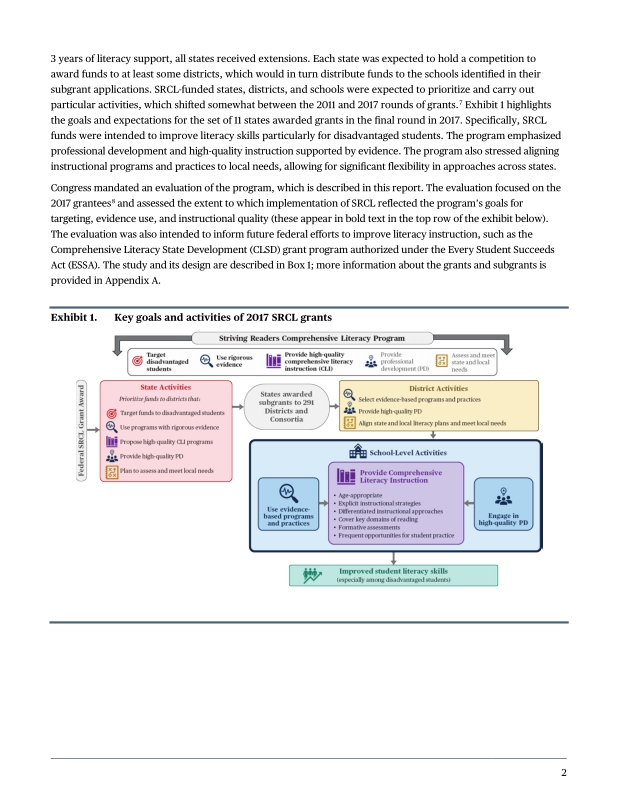
Exhibit 1. Key goals and activities of 2017 SRCL grants 5
Exhibit 2. Percentage of SRCL and non-SRCL schools that were disadvantaged, overall and by state 8
Exhibit 3. Percentage of literacy programs purchased with SRCL funds, by strength of evidence, 2018-19 11
Exhibit 4. Percentage of district program purchases by evidence level, 2018-19, by state 12
Exhibit 5. Percentage of teachers meeting benchmarks for 0-6 features of comprehensive literacy instruction, 2019-20, by grade band 15
Exhibit 6. Percentage of teachers meeting benchmarks for features of comprehensive literacy instruction, 2019-20, by grade band 16
Boxes
Box 1. Summary of the study design 6
Box 2. ESSA definitions of strong and moderate evidence 10
Box 3. Six key features of comprehensive literacy instruction 14
Appendix Exhibits
Exhibit A.1. Excerpted priorities, 2017 SRCL NIA 38
Exhibit A.2. SRCL grants and subgrants, by state 40
Exhibit A.3. Percentage of SRCL districts using SRCL funds on types of resources, 2018-19 41
Exhibit A.4. Percentage of Georgia SRCL districts using SRCL funds on types of resources, 2018-19 42
Exhibit A.5. Percentage of Kansas SRCL districts using SRCL funds on types of resources, 2018-19 42
Exhibit A.6. Percentage of Kentucky SRCL districts using SRCL funds on types of resources, 2018-19 43
Exhibit A.7. Percentage of Louisiana SRCL districts using SRCL funds on types of resources, 2018-19 43
Exhibit A.8. Percentage of Maryland SRCL districts using SRCL funds on types of resources, 2018-19 44
Exhibit A.9. Percentage of Minnesota SRCL districts using SRCL funds on types of resources, 2018-19 44
Exhibit A.10. Percentage of Montana SRCL districts using SRCL funds on types of resources, 2018-19 45
Exhibit A.11. Percentage of New Mexico SRCL districts using SRCL funds on types of resources, 2018-19 45
Exhibit A.12. Percentage of North Dakota SRCL districts using SRCL funds on types of resources, 2018-19 46
Exhibit A.13. Percentage of Ohio SRCL districts using SRCL funds on types of resources, 2018-19 46
Exhibit A.14. Percentage of Oklahoma SRCL districts using SRCL funds on types of resources, 2018-19 47
Exhibit A.15. Background on state SRCL grants 48
Exhibit A.16. State requirements for targeting disadvantaged students 50
Exhibit A.17. State approaches to use of evidence 53
Exhibit A.18. State technical assistance after subgrant award 56
Exhibit B.1. Data sources, including the sample, timing of data collection, response rate, and information obtained from each source 59
Exhibit B.2. Timeline of state director interviews 61
Exhibit B.3. District sample and response rate by state 65
Exhibit B.4. Initial and reserve school sample, by stratum, for an example state 66
Exhibit B.5. Initial and realized school sample by stratum 66
Exhibit B.5a. Districts with sampled schools 67
Exhibit B.6. Realized school sample by urbanicity and stratum 67
Exhibit B.7. Wave 1 sample and response rate for the school leader survey, by stratum 68
Exhibit B.8. Targeted number of schools and teachers by grade span stratum 69
Exhibit B.9. Wave 1 teacher sample and response rate by stratum 70
Exhibit B.10. Wave 2 teacher sample and response rate by stratum 70
Exhibit B.11. Survey sample sizes by state 71
Exhibit B.12. Percentage of teachers with missing data by feature of comprehensive literacy instruction 82
Exhibit B.13. Items included for pre-K 82
Exhibit B.14. Items included for grades K-12 83
Exhibit B.15. Assignment of points to a teacher based on expert ratings of key domains of literacy 85
Exhibit B.16. Scoring (number of points assigned) for emphasis on key domains of literacy, pre-K 86
Exhibit B.17. Scoring (number of points assigned) for emphasis on key domains of literacy, kindergarten 86
Exhibit B.18. Scoring (number of points assigned) for emphasis on key domains of literacy, grade 1 87
Exhibit B.19. Scoring (number of points assigned) for emphasis on key domains of literacy, grade 2 87
Exhibit B.20. Scoring (number of points assigned) for emphasis on key domains of literacy, grade 3 88
Exhibit B.21. Scoring (number of points assigned) for emphasis on key domains of literacy, grades 4-5 88
Exhibit B.22. Scoring (number of points assigned) for emphasis on key domains of literacy, grades 6-8 89
Exhibit B.23. Scoring (number of points assigned) for emphasis on key domains of literacy, grades 9-12 89
Exhibit B.24. Items and scoring (number of points assigned) for explicit instruction, pre-K 91
Exhibit B.25. Items and scoring (number of points assigned) for explicit instruction, kindergarten 92
Exhibit B.26. Items and scoring (number of points assigned) for explicit instruction, grade 1 93
Exhibit B.27. Items and scoring (number of points assigned) for explicit instruction, grade 2 94
Exhibit B.28. Items and scoring (number of points assigned) for explicit instruction, grade 3 95
Exhibit B.29. Items and scoring (number of points assigned) for explicit instruction, grades 4-5 96
Exhibit B.30. Items and scoring (number of points assigned) for explicit instruction, grades 6-8 96
Exhibit B.31. Items and scoring (number of points assigned) for explicit instruction, grades 9-12 97
Exhibit B.32. Items and scoring rule for reported use of differentiated instructional strategies for struggling readers, all grades 98
Exhibit B.33. Items and scoring rule for use of formative assessment, all grades 99
Exhibit B.34. Items and scoring rule for frequent opportunities for practice in writing, pre-K 100
Exhibit B.35. Items and scoring rule for frequent opportunities for practice in writing, grades K-3 100
Exhibit B.36. Items and scoring rule for frequent opportunities for practice in writing, grades 4-12 101
Exhibit B.37. Items and scoring rule for frequent opportunities for practice in reading, pre-K 102
Exhibit B.38. Item and scoring rule for frequent opportunities for practice in reading, grades K-3 102
Exhibit B.39. Item for age-appropriate reading materials, grades 4-12 103
Exhibit B.40. "Old" and CCR Lexile level ranges by grade band 104
Exhibit B.41. Scoring for assignment of age-appropriate reading materials 104
Exhibit B.42. States' criteria for classifying schools as disadvantaged 107
Exhibit B.43. Numbers of matched and unmatched SRCL schools and matched comparison schools, by state 114
Exhibit B.44. Concordance statistics for propensity-score model 115
Exhibit B.45. Baseline equivalence information for students in trend analysis sample 116
Exhibit B.46. Baseline equivalence information for students in trend analysis sample, disadvantaged students only 117
Exhibit C.1. Percentage of SRCL and non-SRCL schools in the most disadvantaged quartile on one or more indicators, 2018-19, by state 120
Exhibit C.2. Percentages of SRCL schools and non-SRCL schools identified as being disadvantaged, by measure and state 121
Exhibit C.3. Percentages of schools missing data required for measuring targeting, by measure and state 122
Exhibit C.4a. Percentage of SRCL and non-SRCL schools in the highest quartile on at least one measure of disadvantage, by state, 2018-19, without... 123
Exhibit C.4b. Percentage of SRCL and non-SRCL schools in the highest quartile on the percentage of students eligible for free or reduced-price lunch, by... 125
Exhibit C.5. Percentage of SRCL and non-SRCL schools classified as disadvantaged according to states' definitions, overall and by state, 2018-19 126
Exhibit C.6. Percentage of SRCL and non-SRCL Schools classified as disadvantaged according to states' definitions, overall and by state, 2018-19,... 127
Exhibit C.7. Purchase of literacy programs by all SRCL districts 128
Exhibit C.8. Percentage of literacy programs purchased with SRCL funds, by evidence level, 2018-19 129
Exhibit C.9. Percentage of district program purchases by evidence level, 2018-19, by state 130
Exhibit C.10. Number of programs purchased by one, two, three, or more districts, 2018-19 131
Exhibit C.11. Percentage of districts by highest evidence level among programs purchased with SRCL funds, 2018-19, by state 132
Exhibit C.12. Percentage of districts by highest evidence level among programs purchased with SRCL funds, including districts that did not buy programs,... 133
Exhibit C.13a. Percentage of teachers in SRCL schools by highest evidence level among programs used in their classrooms, 2018-19 and 2019-20 134
Exhibit C.13b. Percentage of teachers in SRCL schools by highest evidence level among programs used in their classrooms, 2018-19 and 2019-20 135
Exhibit C.14a. Percentage of teachers in SRCL schools by highest evidence level among core and supplemental programs used in their classrooms, 2019-20 136
Exhibit C.14b. Percentage of teachers in SRCL schools by highest evidence level among core and supplemental programs used in their classrooms, 2018-19 136
Exhibit C.15. Participation and perceived utility of technical assistance provided to districts, 2018-19, by state 137
Exhibit C.16. Percentage of districts citing factors in program selection 138
Exhibit C.17. Percentage of pre-K teachers meeting benchmarks for features of comprehensive literacy instruction, 2019-20, by state 139
Exhibit C.18. Percentage of K-3 teachers meeting benchmarks for features of comprehensive literacy instruction, 2019-20, by state 140
Exhibit C.19. Percentage of grade 4-8 teachers meeting benchmarks for features of comprehensive literacy instruction, 2019-20, by state 140
Exhibit C.20. Percentage of grade 9-12 teachers meeting benchmarks for features of comprehensive literacy instruction, 2019-20, by state 141
Exhibit C.21. Percentage of pre-K teachers meeting each benchmark for features of comprehensive literacy instruction, 2018-19 and 2019-20 142
Exhibit C.22. Percentage of teachers meeting each benchmark for features of comprehensive literacy instruction in grades K-3, 2018-19 and 2019-20 142
Exhibit C.23. Percentage of teachers meeting each benchmark for features of comprehensive literacy instruction in grades 4-8, 2018-19 and 2019-20 143
Exhibit C.24. Percentage of teachers meeting each benchmark for features of comprehensive literacy instruction in grades 9-12, 2018-19 and 2019-20 144
Exhibit C.25. Differences in student ELA score trends between SRCL schools and comparable non-SRCL schools, by state 145
Exhibit D.1. Percentage of schools by highest evidence level of programs reported by principals, 2018-19, by state 147
Exhibit D.2. Percentage of districts purchasing only programs supported by strong or moderate evidence, 2018-19, by state 148
Exhibit D.3. Percentage of program purchases supported by strong or moderate evidence and average number of programs purchased by districts, by state 149
Exhibit D.4. Frequency of predicting what might occur next in the text for ECLS-K teachers (2011-12, 2012-13) and SRCL teacher survey respondents (2019-20) 150
Exhibit D.5. Frequency of reading irregularly spelled words for ECLS-K teachers (2011-12, 2012-13) and SRCL teacher survey respondents (2019-20) 151
Exhibit D.6. Frequency of asking students to read and reread passages orally for ECLS-K teachers (2011-12, 2012-13) and SRCL teacher survey respondents... 152
Exhibit D.7. Frequency of asking students to write a narrative with two or more sequenced events for ECLS-K teachers (2011-12, 2012-13) and SRCL teacher... 152
Exhibit D.8. Percentage of teachers meeting benchmarks for 0-5 features of comprehensive literacy instruction, 2019-20, grades 4-8 153
Exhibit D.9. Percentage of teachers meeting benchmarks for 0-5 features of comprehensive literacy instruction, 2019-20, grades 9-12 154
Exhibit D.10. Percentage of teachers meeting benchmarks for 0-5 features of comprehensive literacy instruction, 2018-19, grades 4-8 154
Exhibit D.11. Percentage of teachers meeting benchmarks for 0-5 features of comprehensive literacy instruction, 2018-19, grades 9-12 155
Exhibit D.12. Percentage of teachers by grade band meeting strict, standard, and lenient benchmarks for emphasis on key domains, 2018-19 156
Exhibit D.13. Percentage of teachers by grade band meeting strict, standard, and lenient benchmarks for emphasis on key domains, 2019-20 156
Exhibit D.14. Percentage of teachers by grade band meeting strict, standard, and lenient benchmarks for explicit instruction, 2018-19 157
Exhibit D.15. Percentage of teachers by grade band meeting strict, standard, and lenient benchmarks for explicit instruction, 2019-20 157
Exhibit D.16. Percentage of districts using SRCL expenditures to address district need 158
Exhibit D.17. Percentage of districts using each type of data for continuous improvement 159
Exhibit D.18. Percentage of SRCL districts purchasing PD, by state 160
Exhibit D.19. Percentage of SRCL districts covering features of comprehensive literacy instruction in their SRCL-funded professional development 161
Exhibit D.20. Professional development topics defined as relevant to each feature of comprehensive literacy instruction 163
Exhibit D.21. Percentage of teachers meeting each benchmark, by professional development received, pre-K, 2018-19 164
Exhibit D.22. Percentage of teachers meeting each benchmark, by professional development received, grades K-3, 2018-19 165
Exhibit D.23. Percentage of teachers meeting each benchmark, by professional development received, grades 4-8, 2018-19 165
Exhibit D.24. Percentage of teachers meeting each benchmark, by professional development received, grades 9-12, 2018-19 166
Exhibit D.25. Percentage of teachers meeting each benchmark, by professional development received, pre-K, 2019-20 166
Exhibit D.26. Percentage of teachers meeting each benchmark, by professional development received, grades K-3, 2019-20 167
Exhibit D.27. Percentage of teachers meeting each benchmark, by professional development received, grades 4-8, 2019-20 167
Exhibit D.28. Percentage of teachers meeting each benchmark, by professional development received, grades 9-12, 2019-20 168
Exhibit D.29. Statistically significant differences in the percentage of teachers meeting benchmarks, by professional development relevance 169
Exhibit D.30. Number of teachers by professional development exposure for each feature, 2018-19 170
Exhibit D.31. Number of teachers by professional development exposure for each feature, 2019-20 171
Exhibit D.32. Percentage of SRCL teachers and school leaders describing PD as useful 172
Exhibit D.33. Percentage of school leaders reporting school changes due and not due to SRCL 173
Exhibit D.34. Percentage of early childhood center directors reporting school changes due and not due to SRCL 174
Exhibit D.35. Percentage of SRCL pre-K teachers giving less, the same, or more emphasis compared to expert recommendations in key domains of reading,... 176
Exhibit D.36. Percentage of SRCL teachers in grades K-3 giving less, the same, or more emphasis compared to expert recommendations in key domains of... 177
Exhibit D.37. Percentage of SRCL teachers in grades 4-8 giving less, the same, or more emphasis compared to expert recommendations in key domains of... 178
Exhibit D.38. Percentage of SRCL teachers in grades 9-12 giving less, the same, or more emphasis compared to expert recommendations in key domains of... 179
Exhibit E.1. Components of comprehensive literacy instruction 181
Exhibit E.2. Emphasis on key domains 183
Exhibit E.3. Explicit instruction 184
Exhibit E.4. Differentiated instruction 185
Exhibit E.5. Use of formative assessment 185
Exhibit E.6. Frequent opportunities to practice reading and writing 186
Exhibit E.7. Age-appropriate instruction 186
Exhibit F.1. Process for selecting 10 programs ready for WWC review 189
Exhibit F.2. Terms entered for database searches 189
Exhibit F.3. Programs selected for WWC review 191
Exhibit F.4. Summary of WWC reviews on selected literacy programs 193
Exhibit F.5. Changes to evidence ratings for programs selected for independent evidence review 200
Appendix Boxes
Box B.1. EDGAR Regulatory Definitions of Strong and Moderate Evidence 76
Box F.1. Research Databases Searched 188
*표시는 필수 입력사항입니다.
| *전화번호 | ※ '-' 없이 휴대폰번호를 입력하세요 |
|---|
| 기사명 | 저자명 | 페이지 | 원문 | 기사목차 |
|---|
| 번호 | 발행일자 | 권호명 | 제본정보 | 자료실 | 원문 | 신청 페이지 |
|---|
도서위치안내: / 서가번호:

우편복사 목록담기를 완료하였습니다.
*표시는 필수 입력사항입니다.
저장 되었습니다.
