 https://documents.worldbank.org/en/publication/documents-reports/documentdetail/099057102282440191/IDU18abfcc0a1106d14eee1ace011ff55c80e795


권호기사보기
| 기사명 | 저자명 | 페이지 | 원문 | 기사목차 |
|---|
| 대표형(전거형, Authority) | 생물정보 | 이형(異形, Variant) | 소속 | 직위 | 직업 | 활동분야 | 주기 | 서지 | |
|---|---|---|---|---|---|---|---|---|---|
| 연구/단체명을 입력해주세요. | |||||||||
|
|
|
|
|
|
* 주제를 선택하시면 검색 상세로 이동합니다.
Title page
Contents
Overview of the Public Finance Review 2
Fiscal framework and debt management: mind the gaps 3
Quasi-fiscal activities: can they be managed? 5
Revenue policies: underwhelming and unprogressive 6
Public spending on education: more efficiency and enhanced equity 10
Spending on social protection: better design and targeting 13
Budgeting, planning, and monitoring system: focus on performance, not compliance 15
Transparency of public finances: making budget documentation more useful 16
Inter-governmental fiscal relationship: complicated transfers formula 17
Areas for Reforms 19
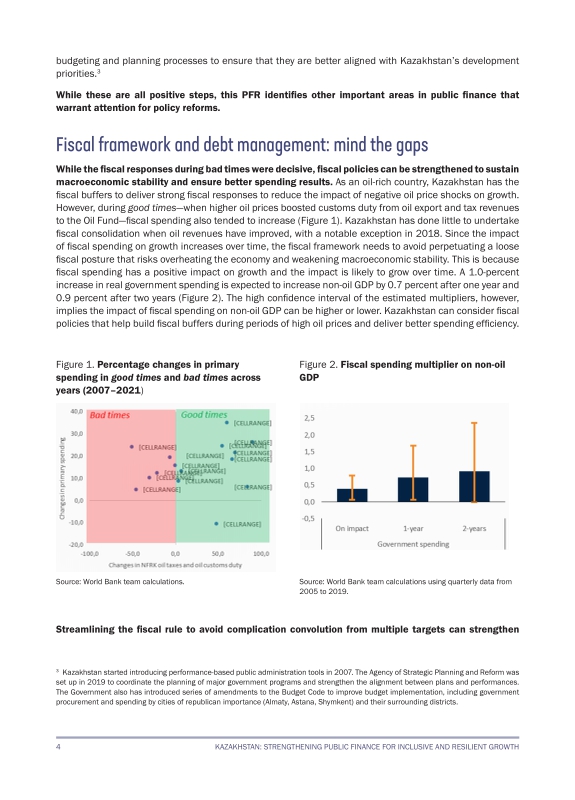
Figure 1. Percentage changes in primary spending in good times and bad times across years (2007-2021) 3
Figure 2. Fiscal spending multiplier on non-oil GDP 3
Figure 3. Gross quasi-fiscal activities by large SOEs and key extrabudgetary funds as a percentage of GDP 6
Figure 4. Total bank bailout net cost for 2009-2020 in KZT trillion 2020 present value 6
Figure 5. Revenue collection and total public expenditures (% of GDP), 2005-2021 7
Figure 6. Tax revenue in international comparison (% of GDP) 7
Figure 7. VAT collection in regional comparison (% of GDP) 8
Figure 8. VAT productivity and C-efficiency comparison, 2019 8
Figure 9. PIT collection in regional comparison (% GDP) 9
Figure 10. PIT productivity ratio, 2019 9
Figure 11. Progressivity of direct taxes in selected countries 10
Figure 12. Government spending on education as a percentage of GDP 11
Figure 13. Proportion of students' performance based on the PISA proficiency test 11
Figure 14. Weak correlation between capital spending per student in 2020 and regional net migration rate 11
Figure 15. Weak correlation between capital spending per student in 2020 and population density 11
Figure 16. Distribution of students' socio-economic status in the NIS and mainstream schools across quintiles 12
Figure 17. Scholarship incidence in Kazakhstan (for students under 25 years old) 12
Figure 18. Spending on SP programs as percentage of GDP, 2016-2021 13
Figure 19. Spending on key SA programs as percentage of GDP, 2016-2021 13
Figure 20. Benefits incidence for SA programs across income quintiles, 2021, percent 14
Figure 21. The benefit-cost ratio of SP programs, 2021 14
Figure 22. Estimated leakage of SA programs, 2021 14
Figure 23. Division of spending responsibilities between the central government and SNGs (level of spending by level of govt, KZT trillion, 2021) 17
Figure 24. Spending by each tier of SNG (% of spending by each tier, by oblast, 2021) 18
Figure 25. Sources of SNG revenues, 2021 18
*표시는 필수 입력사항입니다.
| 전화번호 |
|---|
| 기사명 | 저자명 | 페이지 | 원문 | 기사목차 |
|---|
| 번호 | 발행일자 | 권호명 | 제본정보 | 자료실 | 원문 | 신청 페이지 |
|---|
도서위치안내: / 서가번호:

우편복사 목록담기를 완료하였습니다.
*표시는 필수 입력사항입니다.
저장 되었습니다.
