 https://www.gao.gov/products/gao-24-106264
권호기사보기
| 기사명 | 저자명 | 페이지 | 원문 | 기사목차 |
|---|
| 대표형(전거형, Authority) | 생물정보 | 이형(異形, Variant) | 소속 | 직위 | 직업 | 활동분야 | 주기 | 서지 | |
|---|---|---|---|---|---|---|---|---|---|
| 연구/단체명을 입력해주세요. | |||||||||
|
|
|
|
|
|
* 주제를 선택하시면 검색 상세로 이동합니다.
Title page
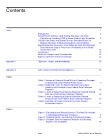
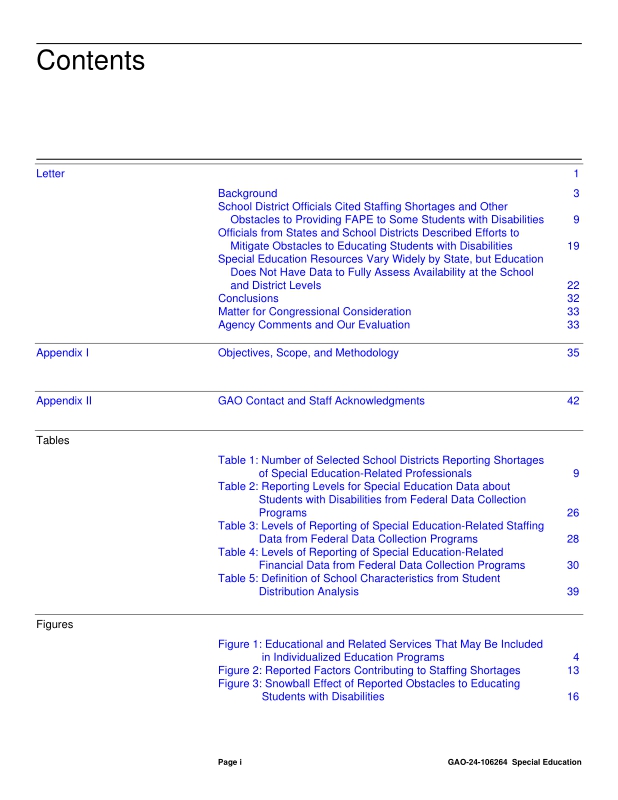
Contents
Highlights 2
Letter 5
Background 7
Staff Involved in Providing Special Education 9
Federal Role in Special Education 9
Variation in IDEA Funding Across States 12
School District Officials Cited Staffing Shortages and Other Obstacles to Providing FAPE to Some Students with Disabilities 13
Staffing Shortages Were the Most Widely Cited Obstacle to Educating Students with Disabilities 13
Officials from Most Districts Also Identified Insufficient Time for Professional Development, Communication Challenges with Parents,... 17
Officials from Most School Districts We Visited Reported Problems Providing FAPE to Some Students with Disabilities 20
Officials from States and School Districts Described Efforts to Mitigate Obstacles to Educating Students with Disabilities 23
Growing the Pipeline for New Staff 23
Hiring Outside Providers 23
Mentorship Programs 24
Promoting Access to Professional Development 24
Providing Parent Resources 24
Restructuring Organizational Charts 25
Capacity-Building Grants to Districts 25
Coordinating through Regional Agencies 26
Special Education Resources Vary Widely by State, but Education Does Not Have Data to Fully Assess Availability at the School and District Levels 26
Many Students with Disabilities Attend Schools Without Key Qualified Special Education Personnel 26
Data Gaps, Particularly at the District and School Level, Hinder Education's Ability to Assess Differences in Special Education and Related Resources 29
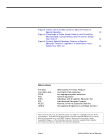
Conclusions 36
Matter for Congressional Consideration 37
Agency Comments and Our Evaluation 37
Appendix I: Objectives, Scope, and Methodology 39
Appendix II: GAO Contact and Staff Acknowledgments 46
Figure 1. Educational and Related Services That May Be Included in Individualized Education Programs 8
Figure 2. Reported Factors Contributing to Staffing Shortages 17
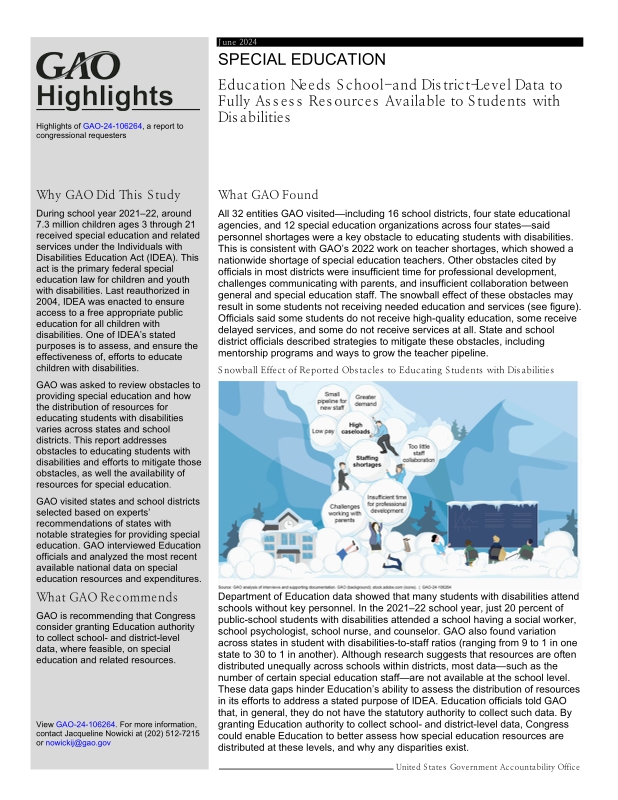
Figure 3. Snowball Effect of Reported Obstacles to Educating Students with Disabilities 20
Figure 4. Voices from the Field: Concerns about the Future of Special Education 22
Figure 5. Percentage of Public School Students with Disabilities Who Attended a School Without Key Personnel, School Year 2020-21 27
Figure 6. Ratio of Students with Disabilities to Special Education Teachers, Regardless of Certification Status, School Year 2021-2022 28
*표시는 필수 입력사항입니다.
| *전화번호 | ※ '-' 없이 휴대폰번호를 입력하세요 |
|---|
| 기사명 | 저자명 | 페이지 | 원문 | 기사목차 |
|---|
| 번호 | 발행일자 | 권호명 | 제본정보 | 자료실 | 원문 | 신청 페이지 |
|---|
도서위치안내: / 서가번호:

우편복사 목록담기를 완료하였습니다.
*표시는 필수 입력사항입니다.
저장 되었습니다.
