 https://www.iza.org/publications/dp/17197/the-impact-of-macroeconomic-conditions-on-long-term-care-evidence-on-prices
권호기사보기
| 기사명 | 저자명 | 페이지 | 원문 | 기사목차 |
|---|
| 대표형(전거형, Authority) | 생물정보 | 이형(異形, Variant) | 소속 | 직위 | 직업 | 활동분야 | 주기 | 서지 | |
|---|---|---|---|---|---|---|---|---|---|
| 연구/단체명을 입력해주세요. | |||||||||
|
|
|
|
|
|
* 주제를 선택하시면 검색 상세로 이동합니다.
Title page
Contents
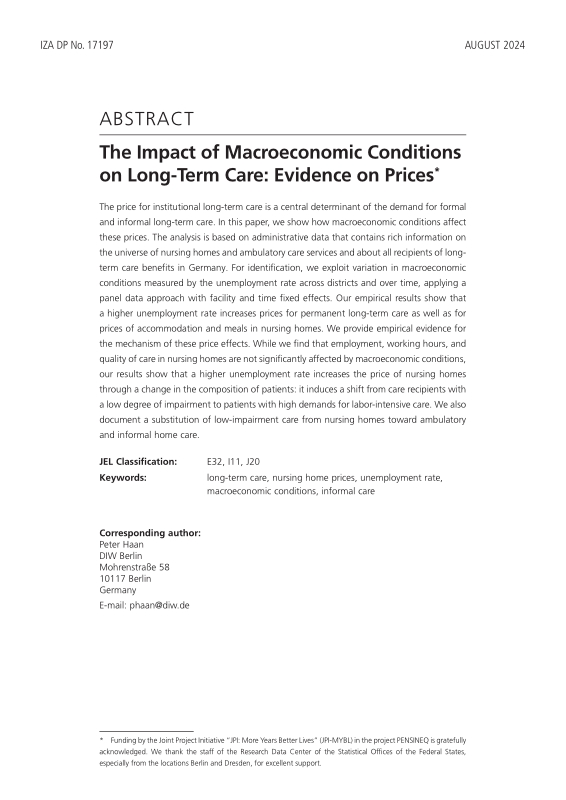
Abstract 3
1. Introduction 4
2. Long-term care and the role of macroeconomic conditions 6
2.1. Institutional background 6
2.2. The effect of macroeconomic conditions on prices of formal long-term care 8
3. Data 8
3.1. Sample 9
3.2. Outcome variables 9
3.3. Macroeconomic conditions 12
3.4. Control variables 14
4. Empirical approach 16
5. Results 16
5.1. Effects on prices of formal long-term care 17
5.2. Potential mechanisms 19
6. Conclusion 23
References 26
Table 1. Descriptive statistics on nursing homes and ambulatory care services, 2005-2015 13
Table 2. Share of cash benefit recipients across districts, 2005-2015 13
Table 3. Effect of a one percentage point increase in unemployment rate on prices of permanent long-term care in German nursing homes, 2005-2015 17
Table 4. Effect of a one percentage point increase in unemployment rate on overall price of permanent long-term care in German nursing homes, robustness,... 18
Table 5. Effect of a one percentage point increase in unemployment rate on overall price of permanent long-term care in German nursing homes, heterogeneity,... 19
Table 6. Effect of a one percentage point increase in unemployment rate on overall price of permanent long-term care in German nursing homes, by type... 20
Table 7. Effect of a one percentage point increase in unemployment rate on employment and working hours in German nursing homes, 2005-2015 21
Table 8. Effect of a one percentage point increase in unemployment rate on staffing in German nursing homes, by degree, 2005-2015 21
Table 9. Effect of a one percentage point increase in unemployment rate on proxies for quality of long-term care in German nursing homes, 2005-2015 22
Table 10. Effect of a one percentage point increase in unemployment rate on recipients of long-term care in German nursing homes, 2005-2015 23
Table 11. Effect of a one percentage point increase in unemployment rate on recipients of long-term care by German ambulatory care providers, 2005-2015 24
Table 12. Effect of a one percentage point increase in unemployment rate on percentage share of cash beneficiaries in population 65 years or older, 2005-2015 24
Figure 1. Mean overall price in 2011 10
Figure 2. Percentage change in mean overall price between 2005 and 2015 11
Figure 3. Mean district unemployment rate in percent over time 14
Figure 4. District unemployment rates in 2011 15
Figure 5. Percentage change in district unemployment rates between 2005 and 2015 15
*표시는 필수 입력사항입니다.
| *전화번호 | ※ '-' 없이 휴대폰번호를 입력하세요 |
|---|
| 기사명 | 저자명 | 페이지 | 원문 | 기사목차 |
|---|
| 번호 | 발행일자 | 권호명 | 제본정보 | 자료실 | 원문 | 신청 페이지 |
|---|
도서위치안내: / 서가번호:

우편복사 목록담기를 완료하였습니다.
*표시는 필수 입력사항입니다.
저장 되었습니다.
