 https://www.wipo.int/publications/en/details.jsp?id=4744&plang=EN


권호기사보기
| 기사명 | 저자명 | 페이지 | 원문 | 기사목차 |
|---|
| 대표형(전거형, Authority) | 생물정보 | 이형(異形, Variant) | 소속 | 직위 | 직업 | 활동분야 | 주기 | 서지 | |
|---|---|---|---|---|---|---|---|---|---|
| 연구/단체명을 입력해주세요. | |||||||||
|
|
|
|
|
|
* 주제를 선택하시면 검색 상세로 이동합니다.
Title page
Contents
Key trends and insights 1
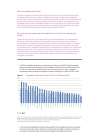
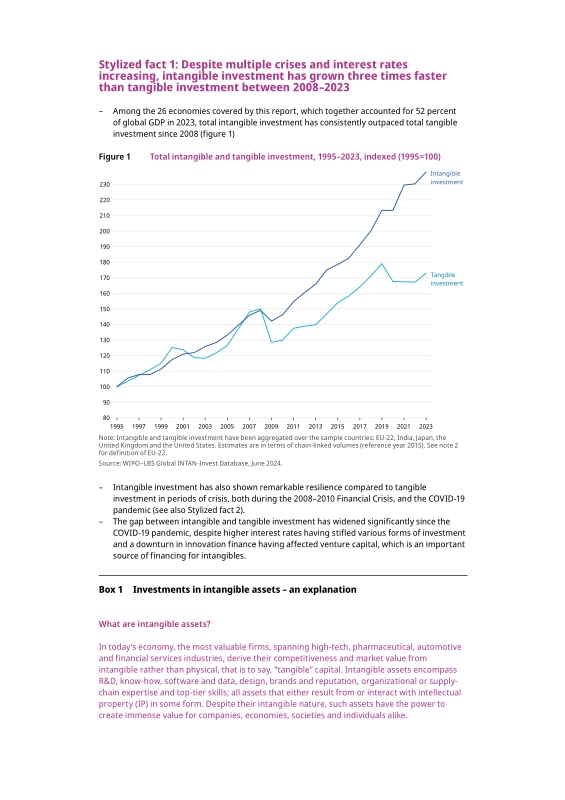
Stylized fact 1: Despite multiple crises and interest rates increasing, intangible investment has grown three times faster than tangible investment between 2008-2023 2
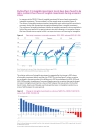
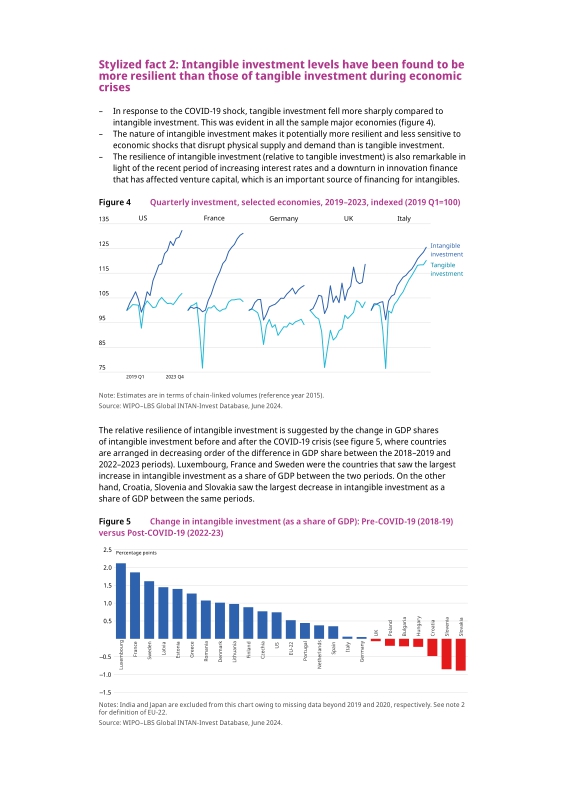
Stylized fact 2: Intangible investment levels have been found to be more resilient than those of tangible investment during economic crises 5
Stylized fact 3: Software and data and brands are the two fastest growing types of intangible asset, both growing three times faster than R&D between 2011-2021 6
Stylized fact 4: Among intangible assets, organizational capital dominates, making up nearly twice the share of total intangible investment claimed by software and data 6
Stylized fact 5: The United States leads in terms of absolute levels of investment in 2023, with a figure six times higher than second-ranked France 7
Stylized fact 6: Intangible investment constitutes a growing share of GDP, relative to tangible investment 8
Stylized fact 7: Intangible investment growth is outpacing tangible investment in India, too 10
References 14
Figure 1. Total intangible and tangible investment, 1995-2023, indexed (1995=100) 2
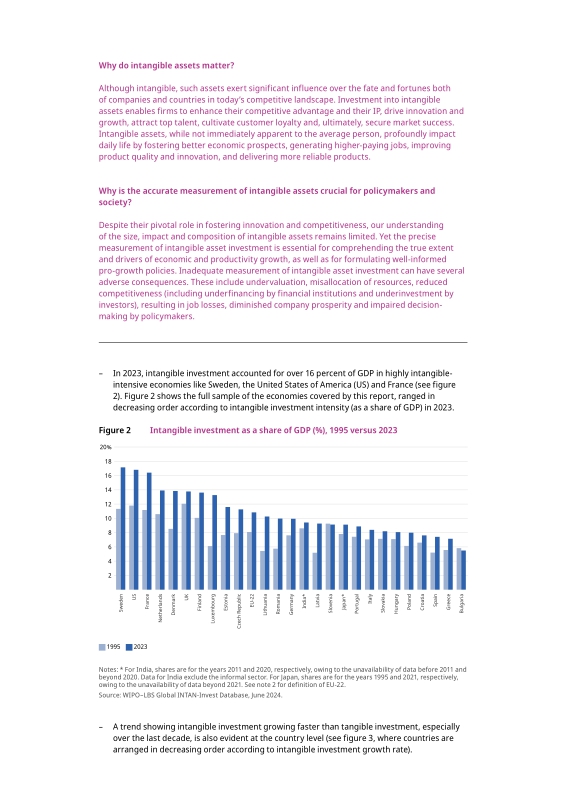
Figure 2. Intangible investment as a share of GDP, 1995 versus 2023 3
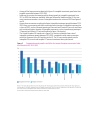
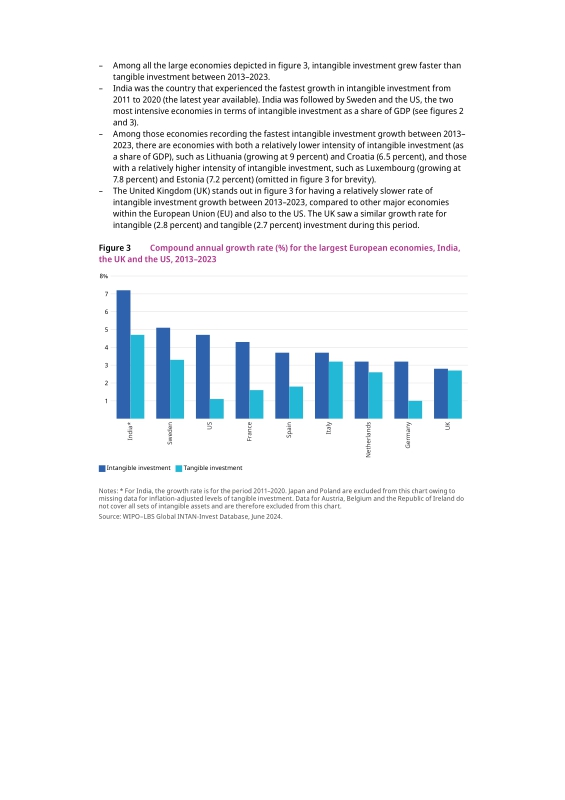
Figure 3. Compound annual growth rate for the largest European economies, India, the UK and the US, 2013-2023 4
Figure 4. Quarterly investment, selected economies, 2019-2023, indexed (2019 Q1=100) 5
Figure 5. Change in intangible investment (as a share of GDP): Pre-COVID-19 (2018-19) versus Post-COVID-19 (2022-23) 5
Figure 6. Compound annual growth rate, 2011-2021 6
Figure 7. Composition of total intangible investment, 2021 6
Figure 8. Intangible investment for the top 5 economies, 2013-2023, in trillion USD PPP 7
Figure 9. Intangible investment, selected economies, 2013-2023, in billion USD PPP 8
Figure 10. Investment as a share of GDP, 1995-2023 8
Figure 11. Investment as a share of GDP, 1995-2023 9
Figure 12a. Investment in India, 2011-2020, indexed (2011=100), excluding informal economy 10
Figure 12b. Investment in India, 2011-2020, indexed (2011=100), formal and informal economy 10
Figure 13a. Investment as a share of GDP, India, 2011-2020 11
Figure 13b. Investment as a share of GDP, India, 2019 11
Figure 14. Intangible investment intensity and GDP per capita, 2011-2020 12
Boxes
Box 1. Investments in intangible assets - an explanation 2
Box 2. About the project and its measurement approach 12
Box Figures
Box figure 2.1. Share of measured and unmeasured intangible investment, 2023 12
Box figure 2.2. Intangible assets under the Corrado, Hulten and Sichel framework 13
*표시는 필수 입력사항입니다.
| *전화번호 | ※ '-' 없이 휴대폰번호를 입력하세요 |
|---|
| 기사명 | 저자명 | 페이지 | 원문 | 기사목차 |
|---|
| 번호 | 발행일자 | 권호명 | 제본정보 | 자료실 | 원문 | 신청 페이지 |
|---|
도서위치안내: / 서가번호:

우편복사 목록담기를 완료하였습니다.
*표시는 필수 입력사항입니다.
저장 되었습니다.
