 https://www.cgdev.org/publication/female-leadership-india-firm-performance-and-culture

권호기사보기
| 기사명 | 저자명 | 페이지 | 원문 | 기사목차 |
|---|
| 대표형(전거형, Authority) | 생물정보 | 이형(異形, Variant) | 소속 | 직위 | 직업 | 활동분야 | 주기 | 서지 | |
|---|---|---|---|---|---|---|---|---|---|
| 연구/단체명을 입력해주세요. | |||||||||
|
|
|
|
|
|
* 주제를 선택하시면 검색 상세로 이동합니다.
Title page
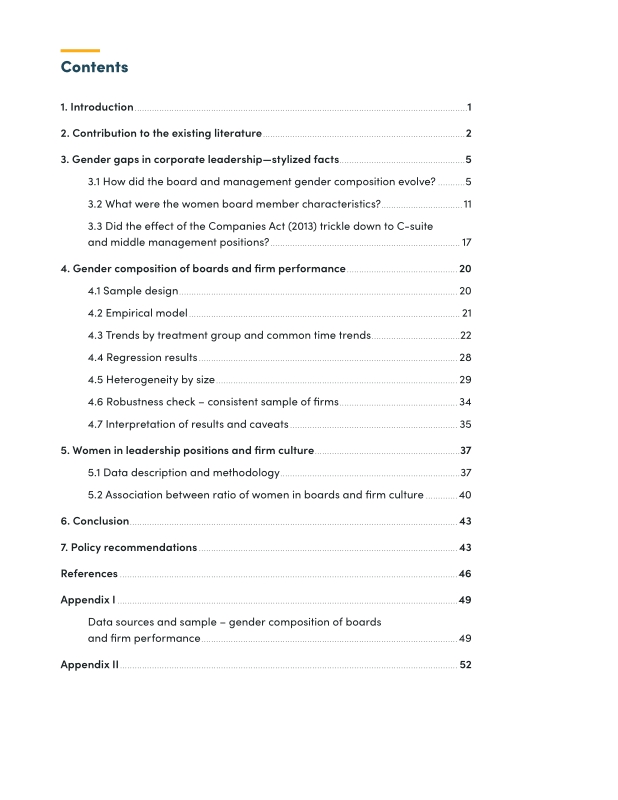
Contents
Abstract 1
1. Introduction 6
2. Contribution to the existing literature 7
3. Gender gaps in corporate leadership-stylized facts 10
3.1. How did the board and management gender composition evolve? 10
3.2. What were the women board member characteristics? 16
3.3. Did the effect of the Companies Act (2013) trickle down to C-suite and middle management positions? 22
4. Gender composition of boards and firm performance 25
4.1. Sample design 25
4.2. Empirical model 26
4.3. Trends by treatment group and common time trends 27
4.4. Regression results 33
4.5. Heterogeneity by size 34
4.6. Robustness check - consistent sample of firms 39
4.7. Interpretation of results and caveats 40
5. Women in leadership positions and firm culture 42
5.1. Data description and methodology 42
5.2. Association between ratio of women in boards and firm culture 45
6. Conclusion 48
7. Policy recommendations 48
References 51
Appendix I. Data sources and sample - gender composition of boards and firm performance 54
Appendix II 57
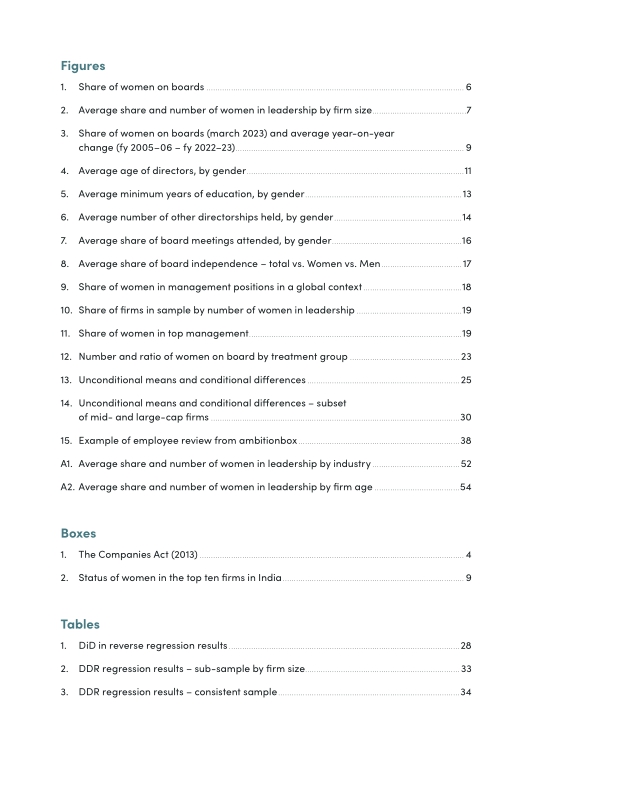
FIGURE 1. Share of women on boards 11
FIGURE 2. Average share and number of women in leadership by firm size 12
FIGURE 3. Share of women on boards (march 2023) and average year-on-year change (fy 2005-06-fy 2022-23) 14
FIGURE 4. Average age of directors, by gender 16
FIGURE 5. Average minimum years of education, by gender 18
FIGURE 6. Average number of other directorships held, by gender 19
FIGURE 7. Average share of board meetings attended, by gender 21
FIGURE 8. Average share of board independence - total vs. Women vs. Men 22
FIGURE 9. Share of women in management positions in a global context 23
FIGURE 10. Share of firms in sample by number of women in leadership 24
FIGURE 11. Share of women in top management 24
FIGURE 12. Number and ratio of women on board by treatment group 28
FIGURE 13. Unconditional means and conditional differences 30
FIGURE 14. Unconditional means and conditional differences - subset of mid- and large-cap firms 35
FIGURE 15. Example of employee review from ambitionbox 43
Boxes
BOX 1. The Companies Act (2013) 9
BOX 2. Status of women in the top ten firms in India 14
FIGURE A1. Average share and number of women in leadership by industry 57
FIGURE A2. Average share and number of women in leadership by firm age 59
*표시는 필수 입력사항입니다.
| *전화번호 | ※ '-' 없이 휴대폰번호를 입력하세요 |
|---|
| 기사명 | 저자명 | 페이지 | 원문 | 기사목차 |
|---|
| 번호 | 발행일자 | 권호명 | 제본정보 | 자료실 | 원문 | 신청 페이지 |
|---|
도서위치안내: / 서가번호:

우편복사 목록담기를 완료하였습니다.
*표시는 필수 입력사항입니다.
저장 되었습니다.
