 https://documents.worldbank.org/en/publication/documents-reports/documentdetail/099091024154518699/P175438164a6530231affc1eee5d610ec2b
권호기사보기
| 기사명 | 저자명 | 페이지 | 원문 | 기사목차 |
|---|
| 대표형(전거형, Authority) | 생물정보 | 이형(異形, Variant) | 소속 | 직위 | 직업 | 활동분야 | 주기 | 서지 | |
|---|---|---|---|---|---|---|---|---|---|
| 연구/단체명을 입력해주세요. | |||||||||
|
|
|
|
|
|
* 주제를 선택하시면 검색 상세로 이동합니다.
Title page
Contents
Abbreviations and Acronyms 6
Foreword 7
Report Team 8
Preface: Why this report? 9
Unlocking the power of healthy longevity: Key messages of this report 10
Executive Summary 14
CHAPTER 1. Introduction: Better health throughout the life course is achievable 20
1.1. Demographic shifts affecting life-course health 21
1.2. Falling fertility, reduced mortality, and cohort effects shape the future population 22
1.3. Implications of future demographic change 24
1.4. Progress in reducing mortality 26
1.5. The epidemiological shifts reshaping life-course health 28
1.6. The economic value of avoidable mortality 33
CHAPTER 2. Healthy longevity, NCDs, and human capital: Levers for action across the life course 39
2.1. Impact pathways of NCDs on human capital and productivity 39
2.2. NCD interventions are needed throughout the life course 43
2.3. Health and wellbeing benefits of a life-course approach to NCDs 45
2.4. The role of innovation in the life-course 46
2.5. Poverty and inequality impacts of NCDs 46
2.6. Tackling NCDs is crucial for gender equality 48
CHAPTER 3. Advancing healthy longevity now: What countries can do 51
3.1. Tackle NCDs with cost-effective, pro-poor interventions 51
3.2. Clinical interventions will lower NCD burdens and improve lives 56
3.3. Leverage social protection, jobs, and long-term care for productive longer lives with dignity 60
3.4. Leverage the power of data for healthy longevity 66
CHAPTER 4. Financing for healthy longevity: Country leadership and key supporting roles for development partners 69
4.1. Country-led financing for healthy longevity agendas 69
4.2. Support from external partners 72
4.3. Navigating the intersections of healthy longevity, climate change, and pandemic vulnerability 74
4.4. Accelerated development and uptake of global public goods for healthy longevity 76
CHAPTER 5. Conclusion: From knowledge to action 79
Appendix A: Data sources, methods, and analytic processes 81
Appendix B: Supplementary analytic materials 88
Appendix C: Acknowledgments 95
Appendix D: Background papers 97
Bibliography 98
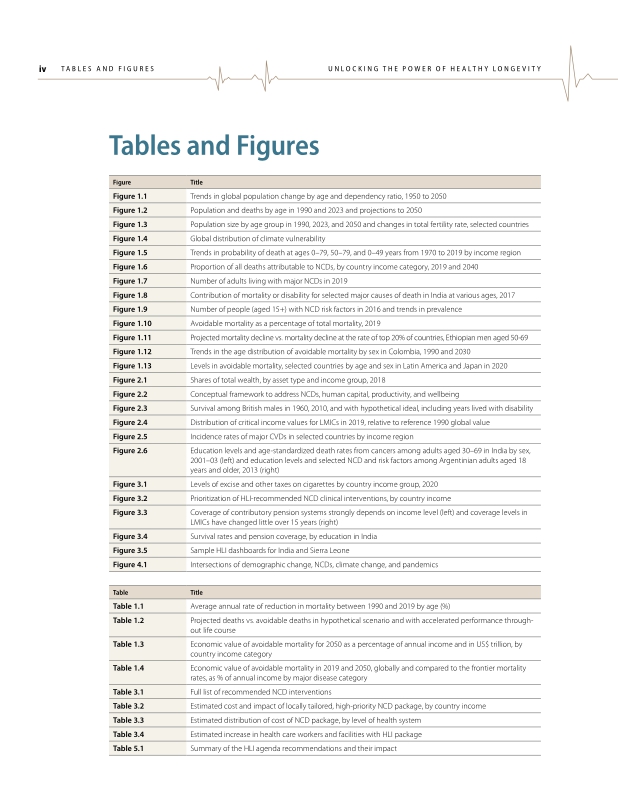
FIGURE 1.1. Trends in global population change by age and dependency ratio, 1950 to 2050 21
FIGURE 1.2. Population and deaths by age in 1990 and 2023 and projections to 2050 22
FIGURE 1.3. Population size by age group in 1990, 2023, and 2050 and changes in total fertility rate, selected countries 24
FIGURE 1.4. Global distribution of climate vulnerability 26
FIGURE 1.5. Trends in probability of death at ages 0-79, 50-79, and 0-49 years from 1970 to 2019 by income region 27
FIGURE 1.6. Proportion of all deaths attributable to NCDs, by country income category, 2019 and 2040 28
FIGURE 1.7. Number of adults living with major NCDs in 2019 29
FIGURE 1.8. Contribution of mortality or disability for selected major causes of death in India at various ages, 2017 30
FIGURE 1.9. Number of people (aged 15+) with NCD risk factors in 2016 and trends in prevalence 31
FIGURE 1.10. Avoidable mortality as a percentage of total mortality, 2019 34
FIGURE 1.11. Projected mortality decline vs. mortality decline at the rate of top 20% of countries, Ethiopian men aged 50-69 35
FIGURE 1.12. Trends in the age distribution of avoidable mortality by sex in Colombia, 1990 and 2030 36
FIGURE 1.13. Levels in avoidable mortality, selected countries by age and sex in Latin America and Japan in 2020 36
FIGURE 2.1. Shares of total wealth, by asset type and income group, 2018 40
FIGURE 2.2. Conceptual framework to address NCDs, human capital, productivity, and wellbeing 41
FIGURE 2.3. Survival among British males in 1960, 2010, and with hypothetical ideal, including years lived with disability 45
FIGURE 2.4. Distribution of critical income values for LMICs in 2019, relative to reference 1990 global value 46
FIGURE 2.5. Incidence rates of major CVDs in selected countries by income region 47
FIGURE 2.6. Education levels and age-standardized death rates from cancers among adults aged 30-69 in India by sex, 2001-03 (left) and education levels... 48
FIGURE 3.1. Levels of excise and other taxes on cigarettes by country income group, 2020 55
FIGURE 3.2. Prioritization of HLI-recommended NCD clinical interventions, by country income 57
FIGURE 3.3. Coverage of contributory pension systems strongly depends on income level (left) and coverage levels in LMICs have changed little over 15 years (right) 63
FIGURE 3.4. Survival rates and pension coverage, by education in India 64
FIGURE 3.5. Sample HLI dashboards for India and Sierra Leone 68
FIGURE 4.1. Intersections of demographic change, NCDs, climate change, and pandemics 76
Boxes
BOX 3.1. Impacts of consumption and taxation of tobacco, alcohol, and SSBs 54
BOX 3.2. Tools from behavioral science can strengthen NCD prevention and control 55
BOX 3.3. Healthy longevity dashboards for India and Sierra Leone 68
BOX 4.1. Small island developing states 71
BOX 4.2. The relevance of multilateral development financing to healthy longevity 73
FIGURE B1. Country classification used in this report, based on the 2020 World Bank income classification 88
FIGURE B2. Population by selected age groups, 25 most populous countries and Colombia and Sierra Leone, 2023 and 2050 89
FIGURE B3. Annual rates of change in mortality rates, by country and age groups, 2000-2019 91
*표시는 필수 입력사항입니다.
| 전화번호 |
|---|
| 기사명 | 저자명 | 페이지 | 원문 | 기사목차 |
|---|
| 번호 | 발행일자 | 권호명 | 제본정보 | 자료실 | 원문 | 신청 페이지 |
|---|
도서위치안내: / 서가번호:

우편복사 목록담기를 완료하였습니다.
*표시는 필수 입력사항입니다.
저장 되었습니다.
