 https://www.cgdev.org/publication/costing-antimicrobial-resistance-interventions

권호기사보기
| 기사명 | 저자명 | 페이지 | 원문 | 기사목차 |
|---|
| 대표형(전거형, Authority) | 생물정보 | 이형(異形, Variant) | 소속 | 직위 | 직업 | 활동분야 | 주기 | 서지 | |
|---|---|---|---|---|---|---|---|---|---|
| 연구/단체명을 입력해주세요. | |||||||||
|
|
|
|
|
|
* 주제를 선택하시면 검색 상세로 이동합니다.
Title page
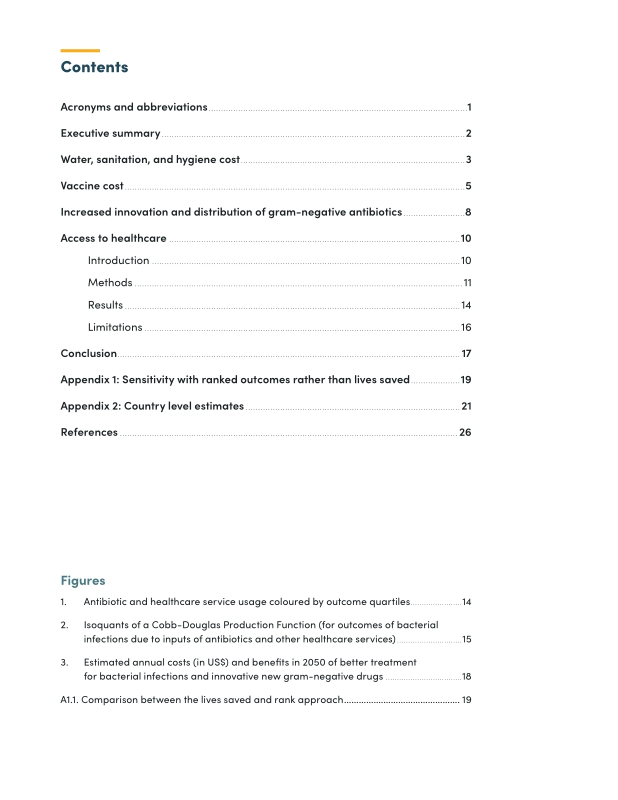
Contents
Abstract 1
Acronyms and abbreviations 5
Executive summary 6
Water, sanitation, and hygiene cost 7
Vaccine cost 9
Increased innovation and distribution of gram-negative antibiotics 12
Access to healthcare 14
Introduction 14
Methods 15
Results 18
Limitations 20
Conclusion 21
Appendix 1: Sensitivity with ranked outcomes rather than lives saved 23
Appendix 2: Country level estimates 25
References 30
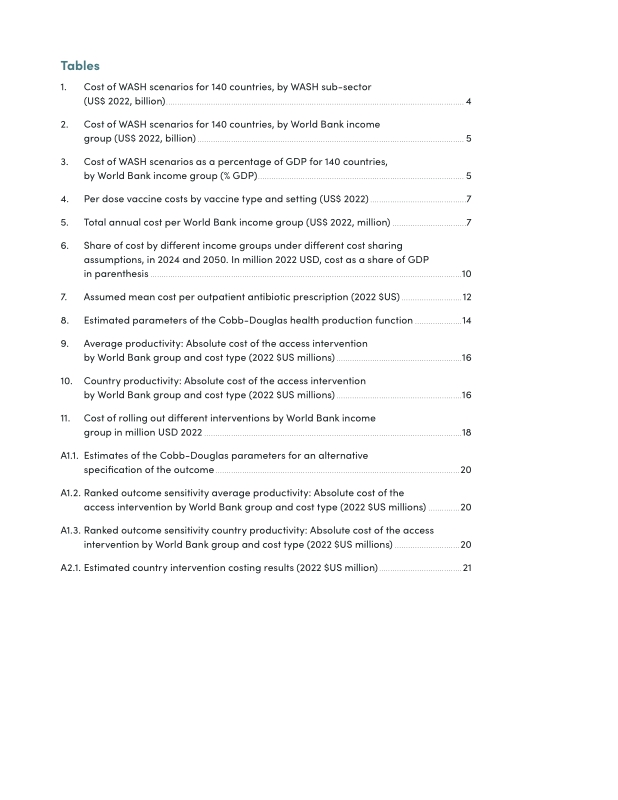
TABLE 1. Cost of WASH scenarios for 140 countries, by WASH sub-sector (US$ 2022, billion) 8
TABLE 2. Cost of WASH scenarios for 140 countries, by World Bank income group (US$ 2022, billion) 9
TABLE 3. Cost of WASH scenarios as a percentage of GDP for 140 countries, by World Bank income group (% GDP) 9
TABLE 4. Per dose vaccine costs by vaccine type and setting (US$ 2022) 11
TABLE 5. Total annual cost per World Bank income group (US$ 2022, million) 11
TABLE 6. Share of cost by different income groups under different cost sharing assumptions, in 2024 and 2050. In million 2022 USD, cost as... 14
TABLE 7. Assumed mean cost per outpatient antibiotic prescription (2022 $US) 16
TABLE 8. Estimated parameters of the Cobb-Douglas health production function 18
TABLE 9. Average productivity: Absolute cost of the access intervention by World Bank group and cost type (2022 $US millions) 20
TABLE 10. Country productivity: Absolute cost of the access intervention by World Bank group and cost type (2022 $US millions) 20
TABLE 11. Cost of rolling out different interventions by World Bank income group in million USD 2022 22
FIGURE 1. Antibiotic and healthcare service usage coloured by outcome quartiles 18
FIGURE 2. Isoquants of a Cobb-Douglas Production Function (for outcomes of bacterial infections due to inputs of antibiotics and other healthcare services) 19
FIGURE 3. Estimated annual costs (in US$) and benefits in 2050 of better treatment for bacterial infections and innovative new gram-negative drugs 22
TABLE A1.1. Estimates of the Cobb-Douglas parameters for an alternative specification of the outcome 24
TABLE A1.2. Ranked outcome sensitivity average productivity: Absolute cost of the access intervention by World Bank group and cost type (2022 $US millions) 24
TABLE A1.3. Ranked outcome sensitivity country productivity: Absolute cost of the access intervention by World Bank group and cost type (2022 $US millions) 24
TABLE A2.1. Estimated country intervention costing results (2022 $US million) 25
FIGURE A1.1. Comparison between the lives saved and rank approach 23
*표시는 필수 입력사항입니다.
| *전화번호 | ※ '-' 없이 휴대폰번호를 입력하세요 |
|---|
| 기사명 | 저자명 | 페이지 | 원문 | 기사목차 |
|---|
| 번호 | 발행일자 | 권호명 | 제본정보 | 자료실 | 원문 | 신청 페이지 |
|---|
도서위치안내: / 서가번호:

우편복사 목록담기를 완료하였습니다.
*표시는 필수 입력사항입니다.
저장 되었습니다.
