 https://documents.worldbank.org/en/publication/documents-reports/documentdetail/099121924141531761

권호기사보기
| 기사명 | 저자명 | 페이지 | 원문 | 기사목차 |
|---|
| 대표형(전거형, Authority) | 생물정보 | 이형(異形, Variant) | 소속 | 직위 | 직업 | 활동분야 | 주기 | 서지 | |
|---|---|---|---|---|---|---|---|---|---|
| 연구/단체명을 입력해주세요. | |||||||||
|
|
|
|
|
|
* 주제를 선택하시면 검색 상세로 이동합니다.
Title page 1
Contents 3
1. What an effective enabling state can do: the role of the state in South Korea's and Finland's transitions to high income, high innovation countries 5
2. The role of states in economic development in ECA 8
States in pre-1990 ECA - creating foundations as well as obstacles for growth 8
Different speeds of growth and innovation in post-1990 ECA 9
How has institutional performance differed between HIC convergers and others? 11
ECA's Large fiscal footprints and the need for efficient delivery of enabling services 15
Avoiding capture: ensuring that markets and opportunities remain competitive 18
Pursuing institutional and policy reforms in good and in bad times 20
3. Evolving the role of the state across different functions 23
The role of states in innovation in ECA 24
4. Conclusions and policy implications 27
Figures 5
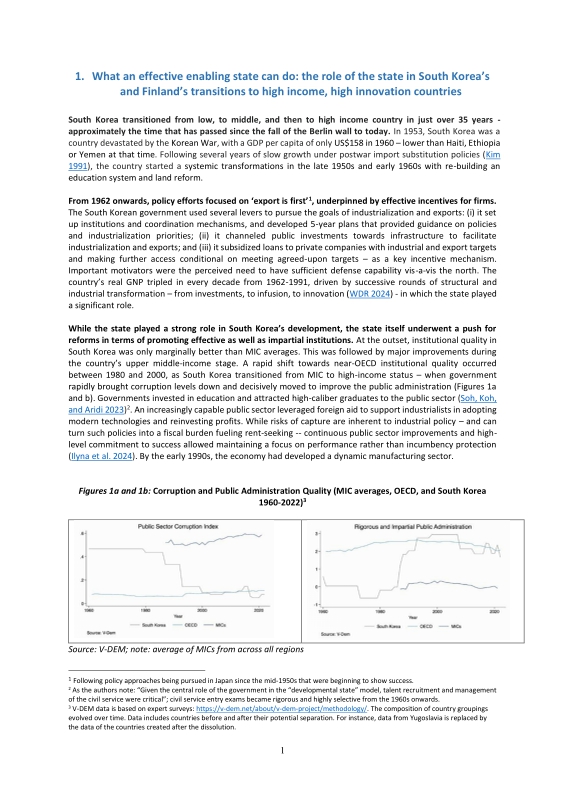
Figures 1a and 1b. Corruption and Public Administration Quality (MIC averages, OECD, and South Korea 1960-2022) 5
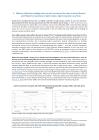
Figure 2. which states succeeded in the MIC to HIC transitions in ECA and how fast GNI per capita, Atlas method (current US$) 10
Figure 3. Global Innovation Index ratings 11
Figure 4. Rule of Law performance 1996 to 2022 12
Figure 5. GDP per capita and government effectiveness 12
Figure 6. Current middle-income countries compared to HIC convergers five years prior to reaching high income levels 13
Figure 7a and 7b. Governance and Enterprise Restructuring and Competition Policy 14
Figure 8. Public Sector Corruption Index with pre-and post-1990 periods for selected countries 14
Figure 9. Overall business environment (1993-2023) 15
Figure 10a and 10b. Government expenditure and Size of Government in MICSs by Region 16
Figure 11. Progress on Digitizing core Government Systems 17
Figure 12. Access to State Business Opportunities trends 2000-2020 18
Figure 13. State capture index, 1996-2022 19
Figure 14. Competitiveness among firms and meritocratic selection of management (WEF) 19
Figure 15. State Legitimacy trends - 2005 to 2022 20
Figure 16. Net Lending/Borrowing as % of GDP 22
Figure 17. Change in growth rates before and after the global financial crisis 22
Figure 18. R&D expenditure as % of GDP 25
Figure 19a and b. R&D spending and patent applications (including and excluding Western Europe) 25
Figure 20. Employment ratios of tertiary graduates 26
*표시는 필수 입력사항입니다.
| *전화번호 | ※ '-' 없이 휴대폰번호를 입력하세요 |
|---|
| 기사명 | 저자명 | 페이지 | 원문 | 기사목차 |
|---|
| 번호 | 발행일자 | 권호명 | 제본정보 | 자료실 | 원문 | 신청 페이지 |
|---|
도서위치안내: / 서가번호:

우편복사 목록담기를 완료하였습니다.
*표시는 필수 입력사항입니다.
저장 되었습니다.
