 https://openknowledge.worldbank.org/entities/publication/297f3a26-6fbd-42d8-bdf1-de5d5d4da61c


권호기사보기
| 기사명 | 저자명 | 페이지 | 원문 | 기사목차 |
|---|
| 대표형(전거형, Authority) | 생물정보 | 이형(異形, Variant) | 소속 | 직위 | 직업 | 활동분야 | 주기 | 서지 | |
|---|---|---|---|---|---|---|---|---|---|
| 연구/단체명을 입력해주세요. | |||||||||
|
|
|
|
|
|
* 주제를 선택하시면 검색 상세로 이동합니다.
Title page 1
Contents 1
Abstract 2
Introduction and motivation 4
1. Literature review 7
2. Afghanistan context 9
3. Data and methods 11
4. Results 13
4.1. Compared with total luminosity, civilian nighttime lights are better at tracking the evolution of economic activity 13
4.2. Civilian lights show economic activity is growing post 2022 16
4.3. Nighttime lights indicate that the spatial distribution of economic activity has changed since 2020 21
5. Conclusions 23
References 25
Annex A: Additional figures and tables 27
Annex B: Further data validation 30
Annex C: Synthetic controls methodology 34
Tables 15
Table 1. Correlation of GDP and nighttime lights (multiple periods) 15
Figures 6
Figure 1. Comparing lights from the Kandahar city with the Kandahar Airfield 6
Figure 2. Main macroeconomic indicators 10
Figure 3. Evolution of total, civilian, and military luminosity 14
Figure 4. Total and civilian luminosity (Share of national) 16
Figure 5. Evolution of nighttime and real GDP 18
Figure 6. Counterfactual evolution of civilian nighttime lights: Synthetic Control approach 20
Figure 7. Change in civilian nighttime lights relative to 2020 22
Figure 8. Regional civilian lights (% of National) 23
Annex Tables 31
Table B1. Could-free coverage pixel-level measurements (Civilian night time lights) Pixel radiance quintiles in 2020 31
Table B2. Pixel-level distrinution of luminosity Civilian night time lights 33
Table C1. Percent of national civilian luminosity for each province in the synthetic control 36
Table C2. Provinces in synthetic control with their corresponding weights 38
Annex Figures 27
Figure A1. Conflict intensity (Total fatalities) 27
Figure A2. Comparison of total luminosity VIIRS-like and VIIRS data 27
Figure A3. Examples OSM polygons with military installations 28
Figure A4. Examples of military installations identified through our two step process 28
Figure A5. Evolution of luminosty and GDP 29
Figure B1. Could-free coverage pixel-level measurements at the regional level Civilian night time lights 31
Figure B2. Pixel-level distrinution of luminosity: Civilian night time lights 32
Figure C1. Placebo test: Predicting civilian luminosity between 2018 and 2020 35
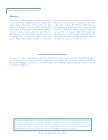
This study uses nighttime lights to examine the evolution of economic activity in Afghanistan after the August 2021 regime change. A year later, nighttime luminosity had dropped by 20 percent, with two-thirds of this decline tied to the pre-planned international military withdrawal. To focus on local economic activity, the study filters out light emissions from foreign military installations, which accounted for up to 30 percent of lights over the past decade. Using civilian nighttime lights to understand the new economic reality in the country indicates a significant economic recovery concentrated in previously conflict-affected regions. By 2023/24, civilian luminosity had surpassed pre-2020/21 levels by 10.5 percent while, in contrast, official gross domestic product indicates an economy that is one-quarter smaller. The findings highlight changes in economic dynamics, including increased informality, shifts in the geographic distribution of activity, and improved security post-Taliban takeover.
*표시는 필수 입력사항입니다.
| *전화번호 | ※ '-' 없이 휴대폰번호를 입력하세요 |
|---|
| 기사명 | 저자명 | 페이지 | 원문 | 기사목차 |
|---|
| 번호 | 발행일자 | 권호명 | 제본정보 | 자료실 | 원문 | 신청 페이지 |
|---|
도서위치안내: / 서가번호:

우편복사 목록담기를 완료하였습니다.
*표시는 필수 입력사항입니다.
저장 되었습니다.
