 https://documents.worldbank.org/en/publication/documents-reports/documentdetail/099122924201549223/P180172169d00708b185ac17f4839899d9c


권호기사보기
| 기사명 | 저자명 | 페이지 | 원문 | 기사목차 |
|---|
| 대표형(전거형, Authority) | 생물정보 | 이형(異形, Variant) | 소속 | 직위 | 직업 | 활동분야 | 주기 | 서지 | |
|---|---|---|---|---|---|---|---|---|---|
| 연구/단체명을 입력해주세요. | |||||||||
|
|
|
|
|
|
* 주제를 선택하시면 검색 상세로 이동합니다.
Title page 1
Contents 3
Executive Summary 4
Introduction 8
Survey Findings 9
Respondents 9
Impact of Russia's Invasion 11
Tax Accounting 12
Informal Payments 19
Tax Inspections 20
Fines and Appeals 22
Quality of Service, Perception of Tax Authorities and Other Aspects of Business Environment 23
Perception of General and Simplified Tax Regimes 31
Tax Compliance 33
Conclusions 36
Annex 1: Survey Methodology 37
Tables 9
Table 1. Number and percentage of respondents by profile 9
Table 2. Average number of employees in 2021 and 2023 10
Table 3. Who was in Charge of Bookkeeping and Tax Accounting in 2023 13
Table 4. Average person-day spent annually on tax compliance procedures 14
Table 5. Annual costs of tax compliance procedures, UAH 16
Table 6. The average costs of accounting specific taxes and duties in Ukraine in 2023, UAH 17
Table 7. Percentage of businesses reported undergoing tax inspections in 2021 and 2023 20
Table 8. During the last tax inspection in 2023, has the tax inspector presented you with an official inspection order? 21
Table 9. Amount of time tax inspectors spent in offices during their latest on-site inspections in 2023 21
Table 10. Has the last tax inspection in 2023 resulted in any of the following negative consequences? 22
Table 11. Three top STS electronic sources used the most in 2023 (percent of respondents) 30
Table 12. Problems faced, while filing for taxes electronically, 2023 (percent of respondents) 30
Table 13. Main advantages of tax regimes in 2023 (percent of respondents registered for a regime) 32
Table 14. Main disadvantages of tax regimes in 2023 (percent of respondents registered for a regime) 32
Table 15. What measures do you think other businesses in this area use to reduce their tax burden? 33
Figures 4
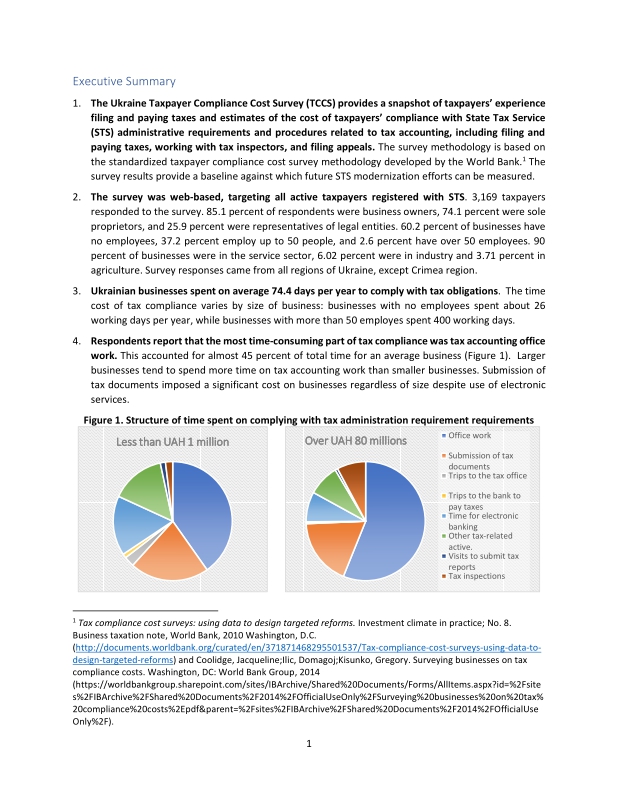
Figure 1. Structure of time spent on complying with tax administration requirement requirements 4
Figure 2. Satisfaction with performance of the STS 5
Figure 3. Problems business faced while filing for taxes in electronic form 6
Figure 4. Most serious obstacles to doing business in Ukraine 7
Figure 5. Number of survey responses by region 8
Figure 6. Types of activities performed in 2023 12
Figure 7. In total, how many employees do you have who were responsible for book-keeping and/or tax accounting for your business in 2023 14
Figure 8. How were tax reports and financial statements submitted to tax authorities in 2023? 19
Figure 9. Reasons for Informal Payments to Third Parties in 2023 19
Figure 10. Percentage of businesses fined, penalized, or requested to pay additional amounts in taxes, duties, or fees by the tax authority in 2023 22
Figure 11. Percentage of businesses appealing against tax decisions 23
Figure 12. Reasons for not submitting a complaint against the decision to the tax authorities 23
Figure 13. Based on your personal experience, please evaluate the following aspects of staff and performance of the State Tax Service (percentage of respondents) 24
Figure 14. An extent to which specific aspects tax compliance system presented problems to businesses in 2023 (percentage of respondents) 25
Figure 15. Evaluate the quality of the provision of services by tax authorities and their client focus 26
Figure 16. Ukrainian Taxpayers Opinions on the Tax System 27
Figure 17. Reasons for visiting the STS web portal (percent of respondents) 28
Figure 18. Please list all sources of information about taxes and tax laws that you use 29
Figure 19. Most serious obstacles to doing business in Ukraine in 2021 and 2023 31
Figure 20. What allows a business to use different tax base reduction schemes? (percent of respondents) 34
Figure 21. Obstacles to business operations (percent of respondents) 34
Figure 22. To what extent have the following practices had a direct impact on your business? (percent of respondents) 35
Annex Tables 39
Table 1. STS Database, survey sample and weighted sample comparison by entity, sector, and oblast 39
Annex Boxes 39
Box 1. Calibration Approach 39
*표시는 필수 입력사항입니다.
| *전화번호 | ※ '-' 없이 휴대폰번호를 입력하세요 |
|---|
| 기사명 | 저자명 | 페이지 | 원문 | 기사목차 |
|---|
| 번호 | 발행일자 | 권호명 | 제본정보 | 자료실 | 원문 | 신청 페이지 |
|---|
도서위치안내: / 서가번호:

우편복사 목록담기를 완료하였습니다.
*표시는 필수 입력사항입니다.
저장 되었습니다.
