 https://www.iza.org/publications/dp/17781/try-to-balance-the-baseline-a-comment-on-parent-teacher-meetings-and-student-outcomes-evidence-from-a-developing-country-by-islam-2019
권호기사보기
| 기사명 | 저자명 | 페이지 | 원문 | 기사목차 |
|---|
| 대표형(전거형, Authority) | 생물정보 | 이형(異形, Variant) | 소속 | 직위 | 직업 | 활동분야 | 주기 | 서지 | |
|---|---|---|---|---|---|---|---|---|---|
| 연구/단체명을 입력해주세요. | |||||||||
|
|
|
|
|
|
* 주제를 선택하시면 검색 상세로 이동합니다.
Title page 1
Contents 1
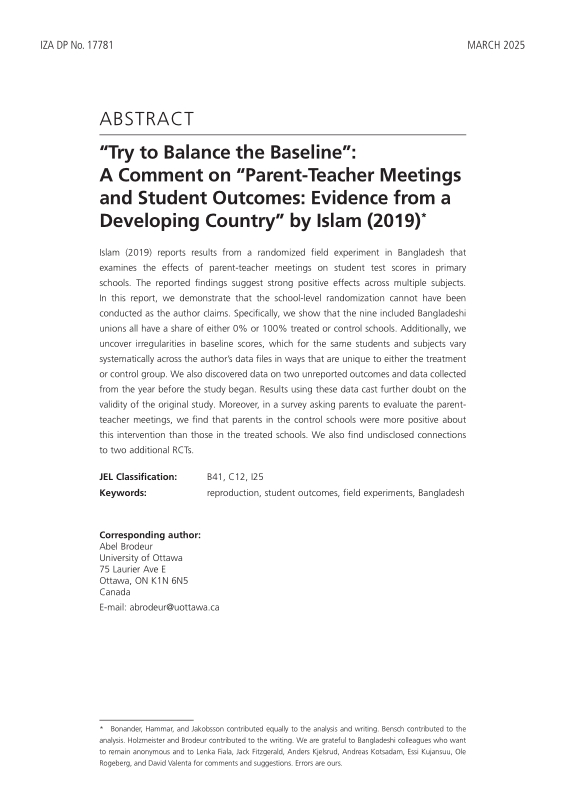
Abstract 3
1. Introduction 4
2. Intervention and context 5
2.1. Interconnection with other field experiments 6
3. A non-randomized intervention 8
4. Additional data irregularities 10
4.1. Inconsistencies in reported data collection timing and data labels 10
4.2. Missing, non-distinct, and non-matching student IDs 11
4.3. Unreported pre-treatment and outcome data 12
4.4. Inconsistencies in baseline test scores for the same students 15
4.5. Irregular grouping among controls in the 2011 GPA data 17
4.6. Being in the household survey sample is strongly correlated with treatment and outcomes 17
4.7. A closer look at the follow-up survey: A multitude of inconsistencies 20
4.8. Different schools are defined as treated in the teacher absence analysis 24
4.9. The control group was even more positive about the treatment 24
4.10. A comment on the costs of the intervention 25
5. Robustness checks 26
5.1. Main analyses with alternative baselines as control variables 26
5.2. Panel data analysis of midline results using final marks from 2010 as pre-treatment data 27
6. Conclusion 27
References 29
Appendices 30
A. Replication package structure 30
B. Computational reproducibility 31
C. Matching datasets 31
D. Permutation test for unique values 31
E. Additional figures and tables 33
Tables 12
Table 1. Total number of government primary schools (GPS) per union in February 2025 (IPEMIS 2025), and number of GPS included in Islam (2019)... 12
Table 2. Baseline variables available for the four studied subjects (math, English, Bengali, and science) identified in various datasets in Islam (2019)'s... 13
Table 3. Comparison of regression estimates with treatment and household survey sampling dummies, based on our matched data files 20
Table 4. Robustness reproduction of Table 8, Panel A: Parental self-report in 2014 in Islam (2019) 22
Table 5. Treated and control parents' evaluations of parent-teacher meetings 25
Table 6. Panel data analysis for six subjects (Grade 4, 2011) 28
Figures 9
Figure 1. Allocation of treated and untreated schools on the union level in Islam (2019). Union-level shares of treated schools are presented in parentheses 9
Figure 2. Results of a permutation test randomly permuting the school-level treatment variable 10,000 times, counting the number of unions with 0%... 10
Figure 3. Map of the three upazilas (Assasuni, Koyra, and Paikgachha) highlighting the nine unions sampled in Islam (2019) 11
Figure 4. Distributions of variables labeled "final marks in 2010" and "final marks in 2011" as well as baseline test scores from the 2011 data in mathematics 14
Figure 5. Comparison of baseline test scores in grade 3, 2012, from Islam (2019)'s analysis files (variables named *12b1) and alternative baseline variables... 16
Figure 6. Histograms of the baseline and midline test scores for grade 3, 2012, by treatment group and subject 18
Figure 7. Replication of Figure A4 in Islam (2019) without smoothing 19
Appendix Tables 39
Table A1. Treatment comparison between Islam (2019) and Begum et al. (2022) 39
Table A2. Results of a permutation test randomly permuting the school-level treatment assignment to baseline test scores 10,000 times 40
Table A3. Adjusted reproduction of Table A11: Teacher absences in 2011 41
Table A4. Robustness checks with alternative baseline score sets (original baselines, complete case subset with non-missing values on both baseline variable sets,... 42
Appendix Figures 32
Figure A1. Flowchart for grade 4, 2011. Datasets refer to Islam (2019)'s replication package 32
Figure A2. Flowchart for grade 3 and 5, 2012. Datasets refer to Islam (2019)'s replication package 33
Figure A3. Comparison of baseline test scores in grade 4, 2011, from Islam (2019)'s analysis files (variables named *10b) and alternative baseline variables... 34
Figure A4. Comparison of baseline test scores in grade 5, 2012 from Islam (2019)'s analysis files (variables named *12b1) and alternative baseline variables... 35
Figure A5. Histograms of the baseline and midline test scores for grade 4, 2011, by treatment group and subject 36
Figure A6. Histograms of the baseline and midline test scores for grade 5, 2012, by treatment group and subject 37
Figure A7. Screenshot of Figure A4 in Islam (2019) 38
*표시는 필수 입력사항입니다.
| *전화번호 | ※ '-' 없이 휴대폰번호를 입력하세요 |
|---|
| 기사명 | 저자명 | 페이지 | 원문 | 기사목차 |
|---|
| 번호 | 발행일자 | 권호명 | 제본정보 | 자료실 | 원문 | 신청 페이지 |
|---|
도서위치안내: / 서가번호:

우편복사 목록담기를 완료하였습니다.
*표시는 필수 입력사항입니다.
저장 되었습니다.
