 https://documents.worldbank.org/en/publication/documents-reports/documentdetail/099310203242527356


권호기사보기
| 기사명 | 저자명 | 페이지 | 원문 | 기사목차 |
|---|
| 대표형(전거형, Authority) | 생물정보 | 이형(異形, Variant) | 소속 | 직위 | 직업 | 활동분야 | 주기 | 서지 | |
|---|---|---|---|---|---|---|---|---|---|
| 연구/단체명을 입력해주세요. | |||||||||
|
|
|
|
|
|
* 주제를 선택하시면 검색 상세로 이동합니다.
Title page 1
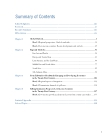
Contents 6
ACKNOWLEDGMENTS 12
FOREWORD 13
EXECUTIVE SUMMARY 15
ABBREVIATIONS 17
CHAPTER 1. GLOBAL OUTLOOK 19
Summary 20
Global context 25
Global trade 26
Global inflation 28
Global financial developments 29
Major economies: Recent developments and outlook 31
Advanced economies 31
China 32
Emerging market and developing economies 33
Recent developments 33
EMDE outlook 34
Per capita income growth 41
Global outlook and risks 47
Summary of global outlook 47
Risks to the outlook 47
Policy challenges 53
Key global challenges 54
EMDE monetary and financial policy challenges 56
EMDE fiscal policy challenges 57
EMDE structural policy challenges 59
References 63
CHAPTER 2. REGIONAL OUTLOOKS 68
EAST ASIA and PACIFIC 69
Recent developments 69
Outlook 70
Risks 72
EUROPE and CENTRAL ASIA 76
Recent developments 76
Outlook 77
Risks 79
LATIN AMERICA and THE CARIBBEAN 83
Recent developments 83
Outlook 84
Risks 86
MIDDLE EAST and NORTH AFRICA 90
Recent developments 90
Outlook 92
Risks 93
SOUTH ASIA 98
Recent developments 98
Outlook 99
Risks 101
SUB-SAHARAN AFRICA 105
Recent developments 105
Outlook 106
Risks 108
References 112
CHAPTER 3. FROM TAILWINDS TO HEADWINDS: Emerging and Developing Economies in the Twenty-First Century 114
Introduction 115
EMDEs' integration into the global economy 119
Trade linkages 119
Commodity market linkages 120
Financial linkages 121
Synchronization of business cycles in EMDEs with those in the rest of the world 126
Evolution of synchronization 126
Drivers of synchronization 127
Business cycle spillovers from major economies 130
Spillovers from the EM3 and AE3 131
Spillovers from China and the United States 131
Spillovers over time and across country groups 132
Challenges confronting EMDEs 134
Weakening growth prospects 134
Difficult external environment 137
Narrowing fiscal space 139
Underdeveloped financial markets 139
Failure to reform amid elevated policy uncertainty 140
Adaptation to sectoral and technological change 140
Climate change and natural disasters 140
Policy priorities in EMDEs 141
Improving growth prospects by boosting investment and productivity 142
Navigating a difficult external environment 145
Enhancing macroeconomic stability 148
Conclusion 151
ANNEX 3.1. Dynamic factor model methodology 152
ANNEX 3.2. SVAR methodology 154
References 157
CHAPTER 4. FALLING GRADUATION PROSPECTS: Low-Income Countries in the Twenty-First Century 166
Introduction 167
Macroeconomic features of LICs and LTMs 171
Growth and structural transformation 175
Growth accelerations in LICs 179
Features of LIC growth accelerations 179
Macroeconomic and development correlates of growth accelerations 181
Challenges to growth and graduation 192
Fragility and conflict 192
Climate change 192
Fiscal vulnerabilities 194
Geography 194
Declining productivity 194
More challenging external environment 195
Growth opportunities 195
Potential demographic dividends 195
Globalization and trade 196
Natural resource endowments 197
Policy priorities 199
Cross-cutting national policy priorities 200
Context-specific national policy priorities 202
Global policies 204
Conclusion 207
ANNEX 4.1. Identifying growth accelerations 209
ANNEX 4.2. Resource discovery event studies 209
ANNEX 4.3. Estimated impact of intense conflict on GDP per capita in LICs 210
References 212
STATISTICAL APPENDIX 221
DATA AND FORECAST CONVENTIONS 226
SELECTED TOPICS 227
Tables 11
TABLE 1.1. Real GDP 21
TABLE 1.2. Emerging market and developing economies 62
TABLE 2.1.1. East Asia and Pacific forecast summary 74
TABLE 2.1.2. East Asia and Pacific country forecasts 75
TABLE 2.2.1. Europe and Central Asia forecast summary 81
TABLE 2.2.2. Europe and Central Asia country forecasts 82
TABLE 2.3.1. Latin America and the Caribbean forecast summary 88
TABLE 2.3.2. Latin America and the Caribbean country forecasts 89
TABLE 2.4.1. Middle East and North Africa forecast summary 96
TABLE 2.4.2. Middle East and North Africa economy forecasts 97
TABLE 2.5.1. South Asia forecast summary 104
TABLE 2.5.2. South Asia country forecasts 104
TABLE 2.6.1. Sub-Saharan Africa forecast summary 110
TABLE 2.6.2. Sub-Saharan Africa country forecasts 111
Figures 9
FIGURE 1.1. Global prospects 22
FIGURE 1.2. Global prospects (continued) 24
FIGURE 1.3. Global trade 26
FIGURE 1.4. Commodity markets 28
FIGURE 1.5. Global inflation 29
FIGURE 1.6. Global financial developments 30
FIGURE 1.7. Major economies: Recent developments and outlook 32
FIGURE 1.8. Recent developments in emerging market and developing economies 34
FIGURE 1.9. Outlook in emerging market and developing economies 35
FIGURE 1.10. Per capita income growth 41
FIGURE 1.11. Global outlook 48
FIGURE 1.12. Downside risks 49
FIGURE 1.13. Upside risks 52
FIGURE 1.14. Global policy challenges 54
FIGURE 1.15. EMDE monetary and financial policy challenges 57
FIGURE 1.16. EMDE fiscal policy challenges 58
FIGURE 1.17. EMDE structural policy challenges 60
FIGURE 2.1.1. China: Recent developments 70
FIGURE 2.1.2. EAP excluding China: Recent developments 71
FIGURE 2.1.3. EAP: Outlook 72
FIGURE 2.1.4. EAP: Risks 73
FIGURE 2.2.1. ECA: Recent developments 77
FIGURE 2.2.2. ECA: Outlook 78
FIGURE 2.2.3. ECA: Risks 80
FIGURE 2.3.1. LAC: Recent developments 84
FIGURE 2.3.2. LAC: Outlook 85
FIGURE 2.3.3. LAC: Risks 87
FIGURE 2.4.1. MNA: Recent developments 91
FIGURE 2.4.2. MNA: Outlook 92
FIGURE 2.4.3. MNA: Risks 94
FIGURE 2.5.1. SAR: Recent developments 99
FIGURE 2.5.2. SAR: Outlook 100
FIGURE 2.5.3. SAR: Risks 102
FIGURE 2.6.1. SSA: Recent developments 106
FIGURE 2.6.2. SSA: Outlook 107
FIGURE 2.6.3. SSA: Risks 108
FIGURE 3.1. EMDEs' contribution to global output and growth 116
FIGURE 3.2. EMDEs in global trade 120
FIGURE 3.3. EMDEs in global commodity markets 121
FIGURE 3.4. EMDEs in global financial markets 122
FIGURE 3.5. Synchronization of business cycles 127
FIGURE 3.6. Decomposition of business cycle variance 130
FIGURE 3.7. Spillovers from the EM3 and AE3 132
FIGURE 3.8. Spillovers from China and the United States 133
FIGURE 3.9. Spillovers over time and across country groups 134
FIGURE 3.10. Growth, convergence, and poverty 135
FIGURE 3.11. Potential output growth and long-term growth expectations 136
FIGURE 3.12. Trade and investment fragmentation 137
FIGURE 3.13. Global trade integration 138
FIGURE 3.14. Debt and fiscal conditions 139
FIGURE 3.15. Institutional environment and policy uncertainty 141
FIGURE 3.16. Natural disasters and climate change 142
FIGURE 3.17. Investment accelerations in EMDEs 143
FIGURE 3.18. Trade policy 146
FIGURE 3.19. Fiscal and monetary policy frameworks 150
FIGURE 4.1. Developments in LICs and LTMs 168
FIGURE 4.2. Macroeconomic features of LICs and LTMs 171
FIGURE 4.3. Macroeconomic features of LICs and LTMs (continued) 173
FIGURE 4.4. Macroeconomic features of LICs and LTMs (continued) 174
FIGURE 4.5. Growth and structural transformation since 2000 175
FIGURE 4.6. Growth and structural transformation since 2000 (continued) 177
FIGURE 4.7. Features of growth accelerations 180
FIGURE 4.8. Correlates of growth accelerations 182
FIGURE 4.9. Governance and growth accelerations 184
FIGURE 4.10. Challenges to growth and graduation to middle-income status in LICs 193
FIGURE 4.11. Growth opportunities in LICs 196
FIGURE 4.12. The evolution of key macroeconomic variables around commodity discoveries 198
FIGURE 4.13. National policy priorities 201
FIGURE 4.14. Global policy priorities 205
Boxes 9
BOX 1.1. Regional perspectives: Outlook and risks 36
BOX 1.2. Low-income countries: Recent developments and outlook 42
BOX 3.1. Regional aspects of integration 123
BOX 3.2. Transmission channels of spillovers 128
BOX 4.1. Low-income growth accelerations: Lessons from country case studies 185
Box Tables 11
TABLE B1.2.1. Low-income country forecasts 45
Box Figures 9
FIGURE B1.1.1. Regional outlooks 37
FIGURE B1.1.2. Regional risks 38
FIGURE B1.2.1. LICs: Recent developments 43
FIGURE B1.2.2. LICs: Outlook and risks 44
FIGURE B3.1.1. Trade and financial openness 124
FIGURE B3.1.2. Within-region integration 125
FIGURE B4.1.1. Nepal's growth acceleration 186
FIGURE B4.1.2. Viet Nam's growth acceleration 187
FIGURE B4.1.3. Kenya's growth acceleration 188
FIGURE B4.1.4. Ethiopia's growth acceleration 189
FIGURE B4.1.5. Rwanda's growth acceleration 191
Annex Tables 11
TABLE A3.1.1. Sample, benchmark DFM 153
TABLE A3.1.2. Sample, alternative DFM 153
TABLE A3.2.1. Sample, benchmark SVAR model 154
TABLE A3.2.2. Sign and zero restrictions imposed to identify shocks in the SVAR models 156
TABLE 4.1. List of all LICs 211
TABLE 4.2. List of LICs that turned into middle-income countries since 2000 211
Annex Figures 10
FIGURE A3.1.1. Variance decomposition, by geographic region 154
*표시는 필수 입력사항입니다.
| *전화번호 | ※ '-' 없이 휴대폰번호를 입력하세요 |
|---|
| 기사명 | 저자명 | 페이지 | 원문 | 기사목차 |
|---|
| 번호 | 발행일자 | 권호명 | 제본정보 | 자료실 | 원문 | 신청 페이지 |
|---|
도서위치안내: / 서가번호:

우편복사 목록담기를 완료하였습니다.
*표시는 필수 입력사항입니다.
저장 되었습니다.
