 https://www.iza.org/publications/dp/17853/the-impact-of-austerity-on-mortality-and-life-expectancy
권호기사보기
| 기사명 | 저자명 | 페이지 | 원문 | 기사목차 |
|---|
| 대표형(전거형, Authority) | 생물정보 | 이형(異形, Variant) | 소속 | 직위 | 직업 | 활동분야 | 주기 | 서지 | |
|---|---|---|---|---|---|---|---|---|---|
| 연구/단체명을 입력해주세요. | |||||||||
|
|
|
|
|
|
* 주제를 선택하시면 검색 상세로 이동합니다.
Title page 1
Contents 1
Abstract 3
1. Introduction 4
2. Context and data 10
2.1. Mortality and life expectancy in the United Kingdom 10
2.2. Measuring the impact of austerity 10
3. Results 15
3.1. Empirical strategy 15
3.2. The welfare reform effect on life expectancy 16
3.3. The healthcare spending effect on life expectancy 18
3.4. The combined effect of austerity measures on mortality 20
3.5. Excess mortality and heterogeneous effects 22
3.6. Calculation of the marginal value of public funds 26
3.7. Distributional impact 28
4. Mechanisms and channels 29
4.1. Drug-related deaths 30
4.2. Public social benefits: Testing an income effect 33
4.3. Declining ambulance response quality 36
4.4. Impact on additional health outcomes 38
5. Conclusion 40
References 42
Appendix 46
A. Robustness Checks 46
B. Descriptive Statistics of Dataset 64
C. NHS Worforce 2009-2019 65
Tables 17
Table 1. The impact of austerity on life expectancy in the United Kingdom - welfare results 17
Table 2. The impact of austerity on life expectancy in the United Kingdom - healthcare results 19
Table 3. Calculation of marginal value of public funds 28
Table 4. The impact of austerity on drug-poisoning deaths in the United Kingdom 31
Table 5. The impact of austerity on ambulance response quality in England 37
Table 6. The impact of austerity on child obesity and diabetes in England 40
Figures 5
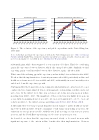
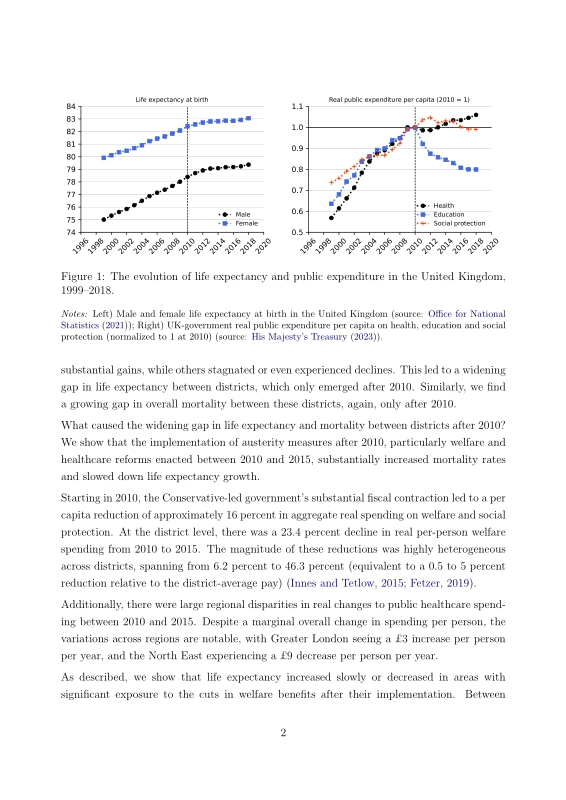
Figure 1. The evolution of life expectancy and public expenditure in the United Kingdom, 1999-2018 5
Figure 2. Geographic variation in life expectancy in the United Kingdom 11
Figure 3. The distribution of austerity shocks across local authority districts in the United Kingdom 12
Figure 4. The association between total welfare impact and total health impact in the regional level 14
Figure 5. The effect of the welfare austerity shock on life expectancy at birth 18
Figure 6. The effect of the healthcare austerity shock on life expectancy at birth 20
Figure 7. The effect of the combined healthcare and welfare austerity shock on life expectancy at birth 21
Figure 8. The effect of austerity measures on life expectancy in the United Kingdom 23
Figure 9. The effect of the combined healthcare and welfare austerity shock on mortality 24
Figure 10. Excess mortality caused by austerity by age group (2010-2019) 25
Figure 11. The association between life expectancy improvement and income in the United Kingdom, 2010-2019 29
Figure 12. Age-adjusted drug-poisoning mortality rate per 100,000 people in England and Wales between 2001 and 2019 30
Figure 13. The effect of the combined healthcare and welfare austerity shock on drug-poisoning mortality 32
Figure 14. The impact of austerity on social benefits for women aged 40-49 and elderly households 35
Figure 15. Ambulance response quality in the England 2008-2017 36
Figure 16. The effect of the combined healthcare and welfare austerity shock on prevalence of obesity among 10-11-year-olds 39
Appendix Tables 49
Table A.1. The impact of austerity on life expectancy in the United Kingdom - jointly estimating austerity and unemployment shocks 49
Table A.2. The impact of austerity on life expectancy in the United Kingdom - welfare results; local authority vs. region results 54
Table A.3. The impact of austerity on female life expectancy at birth in the United Kingdom - healthcare results; alternative treatment definitions 56
Table A.4. The impact of austerity on life expectancy in the United Kingdom before 2016 60
Table B.1. Descriptive statistics of key variables 64
Appendix Figures 47
Figure A.1. Sensitivity analysis for different treatments and outcomes in the main analysis 47
Figure A.2. The welfare shock and the recession economic shock across local authorities in the United Kingdom 48
Figure A.3. The effect of the combined healthcare and welfare austerity shock on life expectancy at birth, with and without accounting for the unemployment shock 50
Figure A.4. The association between life expectancy and exposure to austerity 51
Figure A.5. The total relative impact effect on life expectancy by level of deprivation 51
Figure A.6. The effect of binary treatment on female life expectancy at birth 53
Figure A.7. The effect of the welfare austerity shock on life expectancy at birth 55
Figure A.8. The effect of the health shock on female life expectancy at birth 57
Figure A.9. The effect of additional austerity measures on female life expectancy at birth 59
Figure A.10. The effect of austerity measures on female life expectancy at birth by 2015 60
Figure A.11. Crude mortality rates in the United Kingdom, 2002-2019 61
Figure A.12. Cardiovascular disease mortality rates in the United States (black) and the United Kingdom (blue), 2000-2019 62
Figure A.13. The association between exposure to austerity and CVD mortality rate 63
Figure A.14. Parallel trends in CVD mortality across exposure levels to austerity 63
Figure C.1. Full-time equivalent NHS workforce per capita in England, 2009-2019 65
*표시는 필수 입력사항입니다.
| *전화번호 | ※ '-' 없이 휴대폰번호를 입력하세요 |
|---|
| 기사명 | 저자명 | 페이지 | 원문 | 기사목차 |
|---|
| 번호 | 발행일자 | 권호명 | 제본정보 | 자료실 | 원문 | 신청 페이지 |
|---|
도서위치안내: / 서가번호:

우편복사 목록담기를 완료하였습니다.
*표시는 필수 입력사항입니다.
저장 되었습니다.
