 https://www.iza.org/publications/dp/17852/informal-labor-exchange-teams-and-participation-in-the-labor-market-evidence-from-rural-tanzania
권호기사보기
| 기사명 | 저자명 | 페이지 | 원문 | 기사목차 |
|---|
| 대표형(전거형, Authority) | 생물정보 | 이형(異形, Variant) | 소속 | 직위 | 직업 | 활동분야 | 주기 | 서지 | |
|---|---|---|---|---|---|---|---|---|---|
| 연구/단체명을 입력해주세요. | |||||||||
|
|
|
|
|
|
* 주제를 선택하시면 검색 상세로 이동합니다.
Title page 1
Contents 1
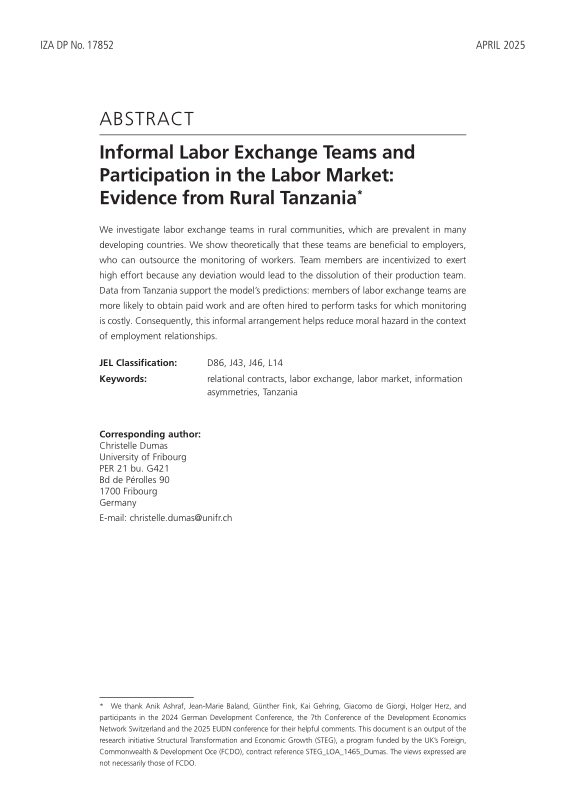
Abstract 3
1. Introduction 4
2. Data and Context 9
2.1. Data 9
2.2. Labor Teams 11
2.3. Labor Demand 13
2.4. Constraints in the Labor Market 14
3. Model 15
3.1. Setup 15
3.2. Team Arrangement 19
3.3. Employment Relationship 21
4. Empirical Analysis 28
4.1. Team Membership 28
4.2. Paid Work 29
4.3. Monitoring 33
5. Validity Tests 36
5.1. Controlling for Observables 38
5.2. Sensitivity Analysis 38
5.3. Propensity Score Matching 39
5.4. Poststratification 40
5.5. Effects on Other Variables Pertaining to Working Time 40
6. Additional Mechanisms 41
7. Conclusion 43
References 45
Appendix 50
A1. Proofs 50
A2. Definition and Construction of Variables 50
A3. Poststratification 53
B1. Additional Tables and Figures 54
Tables 12
Table 1. Reasons to join a labor exchange team 12
Table 2. Why employers prefer to hire individuals 14
Table 3. Why employers prefer to hire teams 14
Table 4. Determinants of participation in a labor team (WLT) 29
Table 5. Paid farm work - Extensive margin 30
Table 6. Paid farm work - Intensive margin 31
Table 7. Paid farm work - Heterogeneity by the team interactions 32
Table 8. Hiring preferences by agricultural task (% by task) 34
Table 9. Average supervision time (hours) by agricultural task and type of hiring 35
Table 10. Tasks on own farm versus paid work, by WLT 37
Table 11. Non-farm paid work, own farm production, and domestic activities 41
Figures 18
Figure 1. Decisions within a period 18
Appendix Tables 55
Table B1. Share of employers who hire for each task 55
Table B2. Descriptive statistics - Surveyed women 55
Table B3. Paid farm work - Extensive margin, full table 56
Table B4. Pay rate for individual vs. group work 57
Table B5. Hiring by agricultural task 58
Table B6. Controlling for additional covariates 59
Table B7. Sensitivity analysis 60
Table B8. Propensity score matching estimations 60
Table B9. PSM - Common support 60
Table B10. Propensity score matching - Balancing test 62
Table B11. Impact of employers' liquidity constraints on paid work 63
Table B12. Paid farm work and employers' liquidity constraints 64
Table B13. Estimation results with post-stratification weights 65
Appendix Figures 54
Figure B1. Bukoba rural district 54
Figure B2. Propensity score matching 61
*표시는 필수 입력사항입니다.
| *전화번호 | ※ '-' 없이 휴대폰번호를 입력하세요 |
|---|
| 기사명 | 저자명 | 페이지 | 원문 | 기사목차 |
|---|
| 번호 | 발행일자 | 권호명 | 제본정보 | 자료실 | 원문 | 신청 페이지 |
|---|
도서위치안내: / 서가번호:

우편복사 목록담기를 완료하였습니다.
*표시는 필수 입력사항입니다.
저장 되었습니다.
