 https://itif.org/publications/2023/09/20/latin-american-subnational-innovation-competitiveness-index
권호기사보기
| 기사명 | 저자명 | 페이지 | 원문 | 기사목차 |
|---|
| 대표형(전거형, Authority) | 생물정보 | 이형(異形, Variant) | 소속 | 직위 | 직업 | 활동분야 | 주기 | 서지 | |
|---|---|---|---|---|---|---|---|---|---|
| 연구/단체명을 입력해주세요. | |||||||||
|
|
|
|
|
|
* 주제를 선택하시면 검색 상세로 이동합니다.
Title page
Contents
KEY TAKEAWAYS 1
INTRODUCTION 3
THE INDEX 4
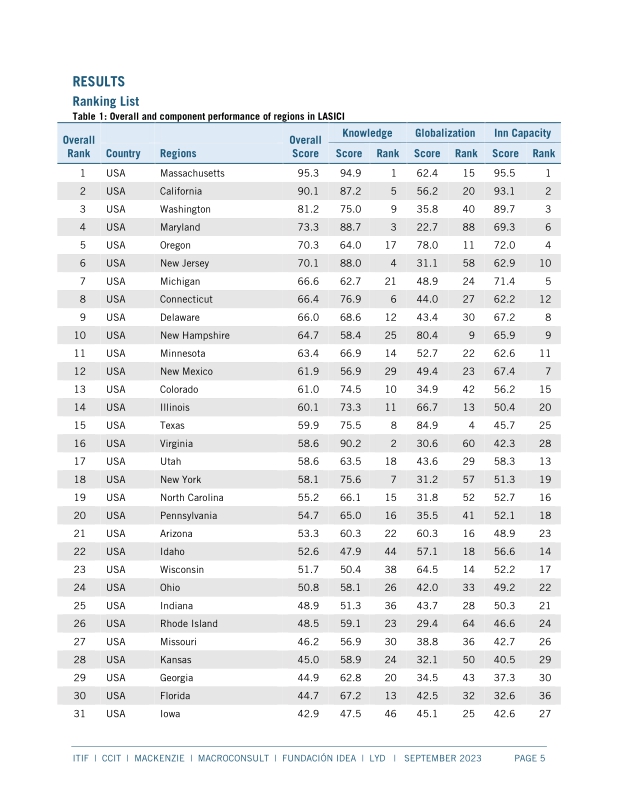
RESULTS 5
Ranking List 5
Index Scores 11
Knowledge Economy 13
Globalization 21
Innovation Capacity 25
POLICY RECOMMENDATIONS 39
Brazil 39
Chile 40
Colombia 41
Mexico 43
Peru 45
United States 47
CONCLUSION 49
Appendix A: Composite and Category Scores Methodology 50
Appendix B: Indicator Methodologies and Weights 51
Appendix C: Estimation Methodologies 52
ENDNOTES 54
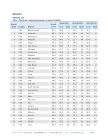
Table 1. Overall and component performance of regions in LASICI 5
Figure 1. Maximum, minimum, quartiles, and median of overall subnational innovation competitiveness scores by country (dots denote the regions) 11
Figure 2. Overall SASICI subnational innovation competitiveness scores 12
Figure 3. Share of the 25-64-year-old population with a bachelor's degree (or equivalent) or higher, 2019 13
Figure 4. Performance map in highly skilled workforce indicator 14
Figure 5. Share of population that is foreign-born and has some tertiary education, 2019 15
Figure 6. Performance map in skilled immigration indicator 16
Figure 7. Share of employees in professional, technical, and scientific services fields, 2019 17
Figure 8. Performance map in professional, technical, and scientific employment indicator 18
Figure 9. PPP-adjusted gross value added per worker in the manufacturing sector, 2019 (USD) 19
Figure 10. Performance map in manufacturing labor productivity indicator (no data on Moquegua) 20
Figure 11. Exports in NAICS 333-335 (or equivalent) as a share of GDP, 2017 21
Figure 12. Performance map in high-tech exports indicator 22
Figure 13. Inward foreign direct investment as a percentage of GDP, 2017-2018 (average) 23
Figure 14. Performance map in inward FDI indicator 24
Figure 15. Share of households that have adopted broadband Internet, 2019 25
Figure 16. Performance map in broadband adoption indicator 26
Figure 17. R&D expenditures as a share of GDP, 2019 27
Figure 18. Performance map in R&D intensity indicator 28
Figure 19. R&D personnel as a share of total employees, 2017-2018 29
Figure 20. Performance map in R&D personnel indicator 30
Figure 21. PCT patent applications per million residents, 2015 31
Figure 22. Performance map in patent applications indicator 32
Figure 23. Economy-wide enterprise birth rate, 2016-2018 33
Figure 24. Performance map in business creation indicator 34
Figure 25. Metric tons of greenhouse gas (measured in CO₂ equivalents) emitted per $10,000 of PPP-adjusted GDP, 2018 35
Figure 26. Performance map in carbon efficiency indicator 36
Figure 27. Venture capital investment received as a percentage of GDP, 2017-2019 (average) 37
Figure 28. Performance map in venture capital indicator 38
Table A1. Indicator weights and descriptions 51
*표시는 필수 입력사항입니다.
| *전화번호 | ※ '-' 없이 휴대폰번호를 입력하세요 |
|---|
| 기사명 | 저자명 | 페이지 | 원문 | 기사목차 |
|---|
| 번호 | 발행일자 | 권호명 | 제본정보 | 자료실 | 원문 | 신청 페이지 |
|---|
도서위치안내: / 서가번호:

우편복사 목록담기를 완료하였습니다.
*표시는 필수 입력사항입니다.
저장 되었습니다.
