
 대표어
대표어


권호기사보기
| 기사명 | 저자명 | 페이지 | 원문 | 기사목차 |
|---|
결과 내 검색
동의어 포함
표제지
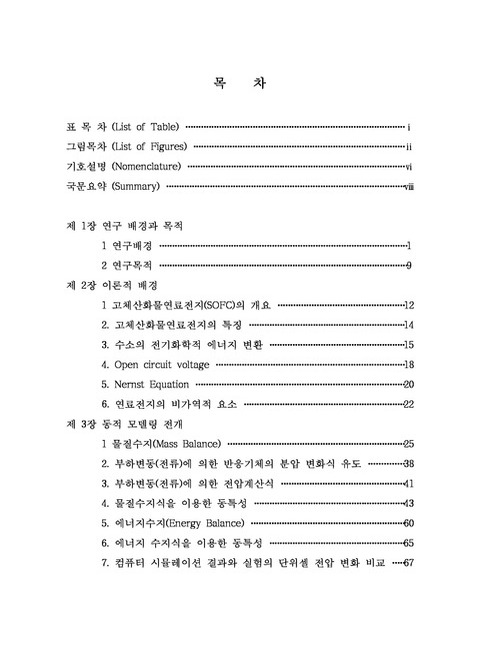
목차
기호설명 11
국문요약 13
제 1 장 연구 배경과 목적 15
1 연구배경 15
2 연구목적 23
제 2 장 이론적 배경 26
1 고체산화물연료전지(SOFC)의 개요 26
2. 고체산화물연료전지의 특징 28
3. 수소의 전기화학적 에너지 변환 29
4. Open circuit voltage 32
5. Nernst Equation 34
6. 연료전지의 비가역적 요소 36
제 3 장 동적 모델링 전개 39
1 물질수지(Mass Balance) 39
가. 전제조건 39
나. 물질수지식 전개 40
2. 부하변동(전류)에 의한 반응기체의 분압 변화식 유도 52
가. 수소의 분압 변화식 52
나. 산소의 분압 변화식 53
다. 물의 분압 변화식 54
3. 부하변동(전류)에 의한 전압계산식 55
4. 물질수지식을 이용한 동특성 57
가. 채널부피를 달리했을 때 각 기체의 분압 및 전압의 변화 57
나. 작동온도를 달리했을 때의 기체의 분압 및 전압의 변화 61
다. 수소의 이용률을 달리했을 경우 기체의 분압 및 전압의 변화 65
라. 공기중 산소 분압 변화(0.21→0.42)에 따른 기체 및 전압의 변화 67
마. 순수한 산소와 공기를 사용했을 때의 기체의 분압 및 전압 변화 71
5. 에너지수지(Energy Balance) 74
6. 에너지 수지식을 이용한 동특성 79
7. 컴퓨터 시뮬레이션 결과와 실험의 단위셀 전압 변화 비교 81
제 4 장 토의 및 분석 86
참고문헌 (References) 88
Appendix 91
Appendix A : 물질수지식을 이용한 반응기체의 분압변화 92
Appendix B : 물질수지식을 이용한 단위셀의 전압변화 97
Appendix C : 에너지수지식을 이용한 단위셀의 온도변화 104
ABSTRACT 106
Fig. 1-1 Comparision of efficeincy of different generation power 18
Fig. 1-2 Map of hydrogen production 18
Fig. 1-3 Schematic of an Individual Fuel Cell 20
Fig. 1-4 Types and utilization of fuel cells 22
Fig. 1-5 Schematic organization of fuel cell system 24
Fig. 2-1 Schematic of solid oxide fuel cell 27
Fig. 2-2 Energy diagram of H₂(g)+1/2O₂(g)→H₂O(l), 101.3kPa, 298K 30
Fig. 2-3 Characteristics of typical polarization curve 37
Fig. 3-1 System Boundary and Flow diagram for H₂ Mass balance 42
Fig. 3-2 System Boundary and Flow diagram for O₂ Mass balance 46
Fig. 3-3 System Boundary and Flow diagram for H₂O Mass balance 50
Fig. 3-4 Channel volume dependence of hydrogen partial pressure drop 59
Fig. 3-5 Channel volume dependence of oxygen partial pressure drop 59
Fig. 3-6 Channel volume dependence of H₂O partial pressure drop 60
Fig. 3-7 Channel volume dependence of voltage drop 60
Fig. 3-8 Operating temperature dependence of hydrogen partial drop 62
Fig. 3-9 Operating temperature dependence of oxygen partial drop 62
Fig. 3-10 Operating temperature dependence of water partial pressure changes 64
Fig. 3-11 Operating temperature dependence of voltage drop 64
Fig. 3-12 Hydrogen utilization dependence of hydrogen partial pressure drop 66
Fig. 3-13 Hydrogen utilization dependence of voltage drop 66
Fig. 3-14 Oxygen partial pressure dependence of oxygen partial pressure drop 68
Fig. 3-15 Oxygen partial pressure dependence of voltage drop 68
Fig. 3-16 Changes of I-V Curve at different oxygen partial pressure 69
Fig. 3-17 Effect of pressure on AES cell performance at 1000℃ 70
Fig. 3-18 Oxygen partial pressure drop at 650℃with pure oxygen and air 72
Fig. 3-19 Voltage drop at 650℃ with pure oxygen and air 72
Fig. 3-20 Change of I-V curve with pure oxygen and air 73
Fig. 3-21 Changes of stack temperature at different variables of kel 80
Fig. 3-22 Changes of stack temperature at different time constants 80
Fig. 3-23 Comparision of Voltage drop between computer simulation and experiment (0A→1A) 82
Fig. 3-24 Comparision of Voltage drop between computer simulation and experiment (0A→2A) 83
Fig. 3-25 Comparision of Voltage drop between computer simulation and experiment (0A→3A) 83
Fig. 3-26 Comparision of Voltage drop between computer simulation and experiment (0A→4A) 84
Fig. 3-27 Comparision of Voltage drop between computer simulation and experiment (0A→5A) 84
Fig. 3-28 Cell performance graph of H2/Air (200cc/min, and 300cc/min) 85
Fig. 3-29 Cell performance graph of H₂/Pure O (250cc/min, and 300cc/min) 85
*표시는 필수 입력사항입니다.
| 전화번호 |
|---|
| 기사명 | 저자명 | 페이지 | 원문 | 기사목차 |
|---|
| 번호 | 발행일자 | 권호명 | 제본정보 | 자료실 | 원문 | 신청 페이지 |
|---|
도서위치안내: / 서가번호:

우편복사 목록담기를 완료하였습니다.
*표시는 필수 입력사항입니다.
저장 되었습니다.
