
 대표어
대표어
권호기사보기
| 기사명 | 저자명 | 페이지 | 원문 | 기사목차 |
|---|
결과 내 검색
동의어 포함
표제지
제출문
보고서 초록
요약문
SUMMARY
CONTENTS
목차
1. 연구과제의 개요 (Overview of the Project) 25
제1절 연구의 필요성 26
2. 국내외 연구현황 (Research Status of Domestic and Foreign Countries) 28
제1절 국외 29
1. 미국 29
2. 중국 30
3. 일본 30
제2절 국내 31
1. 산림생태계 31
2. 담수생태계 31
3. 연안생태계 31
4. 동물생태 31
제3절 국내·외의 연구현황 32
제4절 국내 유사 연구와의 차별성 36
3. 연구과제 수행의 내용 및 결과 (Research Contents and Results) 37
제1절 총괄 38
1. 기후특성 연구 38
가. 서론 38
나. 연구결과 39
다. 결론 65
라. 논의 65
2. 국제협력 65
가. 서론 및 연구목적 65
나. 연구 방법 67
다. 연구결과 68
라. 2단계 국가장기생태연구의 국제협력분야 연구추진 계획 81
마. 제1단계 국제협력분야 연구성과 제시 83
바. 국제협력분야연구 수행을 위한 실질적 예산 배정 필요 83
3. GIS-DB 84
가. 서론 84
나. GIS-DB 구축 84
다. 통합홈페이지 구축 91
라. 2단계 연구에서 향후 연구 과제 92
제2절 육상생태계 93
1. 식생동태 93
가. 서론 93
나. 조사지개황 및 조사방법 94
다. 결과 107
라. 논의 151
2. 1차 생산과 영양염류 순환 152
가. 서론 152
나. 조사 방법 155
다. 결과 158
라. 논의 226
3. 육상식물의 생물계절학 227
가. 서론 227
나. 조사지 개황 및 조사방법 228
다. 결과 239
라/마. 논의 268
4. 곤충 269
가. 서론 269
나. 조사지 개황 및 조사방법 270
다. 결과 273
라. 논의 280
5. 동물 282
가. 서론 282
나. 조사지 개황 및 조사방법 283
다. 결과 290
라. 논의 314
6. 양서·파충류 315
가. 서론 315
나. 조사지 개황 및 조사방법 316
다. 결과 319
라. 논의 328
7. 동해안 산불지역 329
가. 서론 329
나. 조사지 개황 및 조사방법 331
다. 결과 346
라. 논의 422
8. 토양오염 425
가. 서론 425
나. 조사방법 426
다. 결과 427
라. 논의 432
제3절 담수생태계 434
1. 서론 434
2. 낙동강 435
가. 조사지 개황 및 조사방법 435
나. 결과 439
다. 논의 519
3. 한강 525
가. 조사지 개황 및 조사방법 525
나. 결과 531
다. 논의 598
4. 우포늪 601
가. 조사지 개황 및 조사방법 601
나/다. 결과 607
다/라. 논의 690
제4절 연안생태계 695
1. 함평만 695
가. 서론 695
나. 조사지 개황 및 조사방법 695
다. 결과 701
라. 논의 779
제5절 동물생태 781
1. 조류생태 781
가. 연구 내용 781
나. 조사지 개황 및 조사방법 782
다. 결과 785
라. 논의 792
2. 조류 유전 792
가. 실험 방법 792
나. 연구결과 794
다. 논의 800
3. 곤충생태 800
가. 조사방법 800
나. 결과 804
다. 논의 811
4. 목표달성도 및 관련 분야에의 기여도 (Fulfillment of Research Goal and Contribution of Related Field) 814
1. 목표 달성도 815
2. 관련분야에의 기여도 817
5. 연구결과의 활용 및 홍보계획 (Utilization and Information Planning of Results) 819
6. 연구과정에서 수집한 해외과학기술정보 (Scientific Information of Foreign countries) 821
제1절 주관연구기관 822
1. 미국 822
2. 대만 823
제2절 위탁연구기관 824
1. 일본 시가현 비와호·환경과학연구센터 824
2. 일본 가스미가우라·일본국립환경기술연구소 825
3. 홍콩 마이포습지 826
4. 미국 위스콘신 대학 육수학 연구소 827
7. 참고문헌 (References) 828
부록 : 국가장기생태연구방법 (Appendix) 849
Fig. 1-1. Changes of average annual temperature and moisture in Gangneung. 40
Fig. 1-2. Changes of average temperature of January in Gangneung. 41
Fig. 1-3. Changes of average temperature of February in Gangneung. 41
Fig. 1-4. Changes of average temperature of September in Gangneung. 42
Fig. 1-5. Changes of average temperature of December in Gangneung. 42
Fig. 1-6. Changes of average annual moisture in Gangneung. 43
Fig. 1-7. Changes of average moisture of December in Gangneung. 43
Fig. 1-8. Changes of average annual temperature and moisture in Daegwanryeong. 44
Fig. 1-9. Changes of average temperature of March in Daegwanryeong. 44
Fig. 1-10. Changes of average temperature of December in Daegwanryeong. 45
Fig. 1-11. Changes of average annual moisture in Daegwanryeong. 45
Fig. 1-12. Changes of average annual temperature and moisture in Sokcho. 46
Fig. 1-13. Changes of average temperature of February in Sokcho. 46
Fig. 1-14. Changes of average temperature on November in Sokcho. 47
Fig. 1-15. Changes of average annual moisture in Sokcho. 47
Fig. 1-16. Changes of average annual temperature and moisture in Injae. 48
Fig. 1-17. Changes of average temperature of March in Injae. 48
Fig. 1-18. Changes of average moisture of March in Injae. 49
Fig. 1-19. Changes of minimum temperature of April in Injae. 49
Fig. 1-20. Changes of average annual temperature and moisture in Seoul. 50
Fig. 1-21. Changes of average temperature of January in Seoul. 50
Fig. 1-22. Changes of average annual temperature and moisture in Jecheon. 51
Fig. 1-23. Changes of minimum temperature of April in Jecheon. 51
Fig. 1-24. Changes of average annual temperature and moisture in Chungju. 52
Fig. 1-25. Changes of average temperature of January in Chungju. 52
Fig. 1-26. Changes of average temperature of November in Chungju. 53
Fig. 1-27. Changes of average annual temperature and moisture in Mungyeong. 53
Fig. 1-28. Changes of average temperature of June in Mungyeong. 54
Fig. 1-29. Changes of average temperature of December in Mungyeong. 54
Fig. 1-30. Changes of average annual temperature and moisture in Namwon. 55
Fig. 1-31. Changes of maximum temperature of June in Namwon. 55
Fig. 1-32. Changes of average temperature of December in Namwon. 56
Fig. 1-33. Changes of average annual temperature and moisture in Sancheong. 56
Fig. 1-34. Changes of average temperature of June in Sancheong. 57
Fig. 1-35. Changes of average annual moisture in Sancheong. 57
Fig. 1-36. Changes of average annual temperature and moisture in Seoul 58
Fig. 1-37. Changes of average annual temperature and moisture in Yangpyeong. 58
Fig. 1-38. Changes of average temperature of January in Yangpyeong. 59
Fig. 1-39. Changes of minimum temperature of April in Yangpyeong 59
Fig. 1-40. Changes of average annual temperature and moisture in Youngju. 60
Fig. 1-41. Changes of average temperature of January in Youngju. 60
Fig. 1-42. Changes of average temperature of September in Youngju. 61
Fig. 1-43. Changes of average annual temperature and moisture in Taegu. 61
Fig. 1-44. Changes of average temperature of January in Taegu. 62
Fig. 1-45. Changes of average annual temperature and moisture in Pusan. 62
Fig. 1-46. Changes of average annual temperature and moisture in Hapcheon. 63
Fig. 1-47. Changes of average temperature of December in Hapcheon. 63
Fig. 1-48. Changes of average annual temperature and moisture in Mokpo. 64
Fig. 1-49. Changes of average annual temperature of January in Mokpo. 64
Fig. 1-50. Thirty-four countries in ILTER network. 66
Fig. 1-51. Picture taken at Namibia Gobabeb Training and Research Center (August 15, 2006) 70
Fig. 1-52. Plant sampling for biomass estimation ib grassland. 73
Fig. 1-53. American bison. 73
Fig. 1-54. Grassland wildfire. 74
Fig. 1-55. Adelie penguins (pygoscelis adeliae) make their home on the Antarctic Penninsula. 75
Fig. 1-56. This graph illustrates the correlation between the number of breeding pairs of penguins over time... 75
Fig. 1-57. Local students learn how to study plant population dynamics at the jornada basin LTER site. 76
Fig. 1-58. Litter bags placed on the ground at the sevilleta LTer site (above) and the bonanza creek LTER site... 77
Fig. 1-59. Litter bags placed on the ground at the bonanza creek LTER. 77
Fig. 1-60. Scientists from the Coweeta LTER collect water samples to determine the amount of inorganic matter in a stream in North Carolina. 78
Fig. 1-61. To study the movement and absorption of nitrogen in stream ecosystems, researchers release a measurable form of nitrogen from containers like the one shown in... 78
Fig. 1-62. Human and livestock waste releases nitrogen, phosphorus and other nutrients in the ecosystem in amounts many times greater than normal... 78
Fig. 1-63. This study is conducted at 10 stream sites across the U.S. 78
Fig. 1-64. A scientists measures moisture of the downed branches of fuel" before starting the fire. studying how the fuel relates to the intensity of the fire and the... 80
Fig. 1-65. A prescribed (or human-initiated) burn is started after fuel moisture and fuel loads are measured. fires are a natural disturbance and are necessary for maintaining the health... 80
Fig. 1-66. After the prescribed burn, the site looks desolate and lifeless. 80
Fig. 1-67. A tool called a 'duff pin' is inserted into the ground to study how deeply the soil was affected by the fire 80
Fig. 1-68. Two years after the prescribed burn, the plant regrowth is green and vigorous. the nutrients released and increased light availability will benefit... 80
Fig. 1-69. In another controlled burn project at coweeta LTER, scientists are trying to reconstruct he fire regime as it was while Cherokee Indians lived here... 80
Fig. 1-70. Fundamental structure of web GIS-DB server. 85
Fig. 1-71. System structure of web GIS-DB. 85
Fig. 1-72. Main screen of web GIS-DB. 86
Fig. 1-73. Geographical information map of study area (Namsan) 87
Fig. 1-74. Community distribution by permanent quadrat... 87
Fig. 1-75. Analyzing graphs using diverse formula and functions. 88
Fig. 1-76. Graph samples of LTER by Jpgraph. 89
Fig. 1-77. Improved image gallery. 90
Fig. 1-78. Image after click of thumbnail. 90
Fig. 1-79. DB management screen using SQLog. 90
Fig. 1-80. Table and information at access. 91
Fig. 1-81. Homepage 91
Fig. 1-82. Notes and notice board. 91
Fig. 1-83. Material screen 92
Fig. 1-84. Noticed material. 92
Fig. 2-1. A map showing vegetation and land use of Mt. Nam. Dots with numbers indicate the locations that permanent quadrats for long term ecological research were installed. 1 and 4, 2, and 3 and 5 indicate permanent quadrats for pine forest, oak forest, and black locust plantation, respectively. 94
Fig. 2-2. A map showing permanent quadrats on Mt. Wolak. Dots indicate the locations the permanent quadrats for long term ecological research were installed. 95
Fig. 2-3. A map showing permanent quadrats on Mt. Jiri. Dots indicate the locations that permanent quadrats for long term ecologicl al research were installed. 97
Fig. 2-4. A map showing permanent quadrats on Mt. Jumbong. Squares indicate the locations that permanent quadrats for long term ecological research were installed. 98
Fig. 2-5. Permanent quadrats installed on Mt. Nam ; a) Quercus mongolica forest b) Pinus densiflora forest c) Robinia pseudoacacia plantation. 102
Fig. 2-6. Small quadrat numbers in 1ha permanent quadrat of Q. mongolica forest on Mt. Wolak. 103
Fig. 2-7. Small quadrat (20m x 20m) numbers in 1ha permanent quadrat of Q. mongolica and P. densiflora forest on Mt. Jumbong. 104
Fig. 2-8. Small quadrat (10m x 10m) numbers in 1ha permanent quadrat of Q. mongolica and P. densiflora forest on Mt. Jumbong. 105
Fig. 2-9. Small quadrat numbers in four permanent quadrat of Abies holophylla-Q mongolica on Mt. Jumbong. 106
Fig. 2-10. Spatial distribution of major tree species in the Q. mongolica forest permanent plots installed in Mt. Nam. 111
Fig. 2-11-1. Spatial distribution of major tree species in the 1st plot of P. densiflora forest permanent plots installed in Mt. Nam. 112
Fig. 2-11-2. Spatial distribution of major tree species in the 2nd plot of P. densiflora forest permanent plots installed in Mt. Nam. 112
Fig. 2-12. Spatial distribution of major tree species in the R. pseudoacacia forest permanent plots installed in Mt. Nam. 113
Fig. 2-13-1. Spatial distribution of major tree species in the Q. mongolica, P. densiflora and Q. variabilis forests permanent plots installed in Mt. Wolak (2004). 114
Fig. 2-13-2. Spatial distribution of major tree species in the Q. mongolica forest permanent plots installed in Mt. Wolak(2005). 115
Fig. 2-13-3. Spatial distribution of major tree species in the Q. mongolica, P. densiflora and Q. variabilis forests permanent plots installed in Mt. Wolak (2006년). 116
Fig. 2-14. Spatial distribution of major tree species in the Q. mongolica forest permanent plot installed in Mt. Jiri. 117
Fig. 2-15. Spatial distribution of major tree species in the P. densiflora forest permanent plot installed in Mt. Jiri. 118
Fig. 2-16. Spatial distribution of major tree species in the Abies koreana forest permanent plot installed in Mt. Jiri. 118
Fig. 2-17. Spatial distribution of major tree species in the 2nd plot of Q. mongolica forest permanent plot installed in Mt. Jiri. 119
Fig. 2-18. Spatial distribution of major tree species in the Q. mongolica forest permanent plots installed in Mt. Jumbong. 120
Fig. 2-19. A diameter class and spatial distribution of major tree species in the Q. mongolica forest permanent plots installed in Mt. Jumbong. 121
Fig. 2-20. Spatial distribution of major tree species in the Q. mongolica - A. holophylla forest permanent plots installed in Mt. Jumbong. 122
Fig. 2-21. Spatial distribution and diameter classes of major tree species in permanent plot of Q. mongolica forest installed in Mt. Jumbong (circles with different size indicate 2.5, 5, 10, 20, 30, 40, 50, 60, 70, 80, and 90cm class, respectively). 123
Fig. 2-22. Ordination of the Mongolian oak stands based on vegetation data collected in four areas designated for LTER. 124
Fig. 2-23. The number of plant species appeared in permanent quadrats installed in three forest types on Mt. Wolak. 127
Fig. 2-24. A diameter class distribution diagram of major woody plants appeared in the Q. mongolica forest in Mt. Nam. 134
Fig. 2-25. A diameter class distribution diagram of major woody plants appeared in the Q. mongolica forest in Mt. Wolak. 135
Fig. 2-26-1. A diameter class distribution diagram of major woody plants appeared in the 1st plot of Q. mongolica forest in Mt. Jiri. 136
Fig. 2-26-2. A diameter class distribution diagram of major woody plants appeared in the 2nd plot of Q. mongolica forest in Mt. Jiri. 136
Fig. 2-27. A diameter class distribution diagram of major woody plants appeared in the Q. mongolica forest in Mt. Jumbong. 137
Fig. 2-28. A diameter class distribution diagram of major woody plants appeared in the P. densiflora forest in Mt. Nam. 138
Fig. 2-29. A diameter class distribution diagram of major woody plants appeared in the P. densiflora forest in Mt. Wolak. 139
Fig. 2-30. A diameter class distribution diagram of major woody plants appeared in the P. densiflora forest in Mt. Jiri. 140
Fig. 2-31. A diameter class distribution diagram of major woody plants appeared in the P. densiflora forest in Mt. Jumbong. 141
Fig. 2-32. A diameter class distribution diagram of major woody plants appeared in the R. pseudoacacia forest in Mt. Nam. 142
Fig. 2-33. A diameter class distribution diagram of major woody plants appeared in the Q. variabillis forest in Mt. Wolak. 143
Fig. 2-34. A diameter class distribution diagram of major woody plants appeared in the A. koreana forest in Mt. Jiri. 144
Fig. 2-35. A diameter class distribution diagram of major woody plants appeared in the Q. mongolica-A. holophylla forest in Mt. Jumbong. 145
Fig. 2-36. Frequency distribution diagrams of stem vitality of woody plants appeared in Q. mongolical, P. densiflora and R. pseudoacacia forests in Mt. Nam. 146
Fig. 2-37. Frequency distribution diagrams of stem vitality of woody plants appeared in Q. mongolica forest in Mt. Wolak. 147
Fig. 2-38. Frequency distribution diagrams of stem vitality of woody plants appeared in P. densiflora forest in Mt. Wolak. 148
Fig. 2-39. Frequency distribution diagrams of stem vitality of woody plants appeared in Q. variabilis forest in Mt. Wolak. 148
Fig. 2-40. Frequency distribution diagrams of stem vitality of woody plants appeared in Q. mongolica forest in Mt. Jumbong. 149
Fig. 2-41. Frequency distribution diagrams of stem vitality of woody plants appeared in P. densiflora forest in Mt. Jumbong. 150
Fig. 2-42. Frequency distribution diagrams of stem vitality of woody plants appeared in Q. mongolica-A. holophylla forest in Mt. Jumbong. 150
Fig. 2-43. A comparison of species sequence, dominance curves among Q. mongolica forest of four study areas designated for LTER in korea. 151
Fig. 2-44. Nutrient cycling of ecosystem (Alber and Melilio, 2001). 153
Fig. 2-45. Litter trap established in A. holophylla (May, 2006) 157
Fig. 2-46. Litter bag established in the forest floor (Nov. 2006) 158
Fig. 2-47. Correlation between inorganic nitrogen and nutrient in soil. 161
Fig. 2-48. Changes of pH along with forest type. 162
Fig. 2-49. Changes of organic matter content along with forest type. 162
Fig. 2-50. Changes of organic matter content along with forest type. 163
Fig. 2-51. Changes of ammonium along with forest type. 163
Fig. 2-52. Changes of total nitrogen along with forest type. 164
Fig. 2-53. Total phosphorus content of soil with forest type in Mt. Jumgbong. 164
Fig. 2-54. Cation (K+. Ca2+) content of soil with forest type in Mt. Jumgbong. 165
Fig. 2-55. Litter production in A. holophylla and P. densiflora. 165
Fig. 2-56. Changes of standing dead bole mass. 166
Fig. 2-57. Annual amount of input and decomposition of dead bole in Q. mongolica stand. 167
Fig. 2-58. Changes of dead bole mass along with decomposition class in Q. mongolica stand. 167
Fig. 2-59. Ratio of dead bole types in the three forest stands. 168
Fig. 2-60. Monthly changes of litter production of Q. mongolica community in Mt. Nam. 170
Fig. 2-61. Monthly changes of litter production of P. densiflora community in Mt. Nam. 171
Fig. 2-62. Monthly changes of litter production of R. pseudo-acacia community in Mt. Nam. 171
Fig. 2-63. Composition rate of litter of Q. mongolica community in Mt. Nam in 2006. 172
Fig. 2-64. Composition rate of litter of P. densiflora community in Mt. Nam in 2006. 172
Fig. 2-65. Composition rate of litter of R. pseudo-acacia community in Mt. Nam in 2006. 172
Fig. 2-66. Decomposition rate of litter in Mt. Nam. 178
Fig. 2-67. pH of precipitation, stemflow and throughfall in P. densiflora community in Mt Nam. 179
Fig. 2-68. Nutrient input through precipitation, stemflow and throughfall in P. densiflora community in Mt.Nam. 179
Fig. 2-69. Litter production of Q. mongolica community. 181
Fig. 2-70. Litter production of Q. variabilis community. 181
Fig. 2-71. Litter production of P. densiflora community. 182
Fig. 2-72. Changes of total nitrogen content of litter of Q. mongolica community. 182
Fig. 2-73. Changes of total nitrogen content of litter of Q. vaiabilis community. 183
Fig. 2-74. Changes of total nitrogen content of litter of P. densiflora community. 183
Fig. 2-75. Changes of total phosphorus content of litter of Q. mongolica community. 184
Fig. 2-76. Changes of total phosphorus content of litter of Q. vaiabilis community. 184
Fig. 2-77. Changes of total phosphorus content of litter of P. densiflora community. 185
Fig. 2-78. Changes of potassium content of litter of Q. mongolica community. 185
Fig. 2-79. Changes of total potassium content of litter of Q. vaiabilis community. 186
Fig. 2-80. Changes of total potassium content of litter of P. densiflora community. 186
Fig. 2-81. Changes of calcium content of litter of Q. mongolica community. 187
Fig. 2-82. Changes of total calcium content of litter of Q. vaiabilis community. 187
Fig. 2-83. Changes of total calcium content of litter of P. densiflora community. 188
Fig. 2-84. Changes of magnesium content of litter of Q. mongolica community. 188
Fig. 2-85. Changes of total magnesium content of litter of Q. vaiabilis community. 189
Fig. 2-86. Changes of total magnesium content of litter of P. densiflora community. 189
Fig. 2-87. Total nitrogen input through litter production in Q mongolica community 190
Fig. 2-88. Total nitrogen input through litter production in Q. vaiabilis community. 191
Fig. 2-89. Tatal nitrogen input through litter production in P. densiflora community. 191
Fig. 2-90. Total phosphorus input through litter production in Q. mongolica community. 192
Fig. 2-91. Total phosphorus input through litter production in Q. vaiabilis community. 192
Fig. 2-92. Total phosphorus input through litter production in P. densiflora community. 193
Fig. 2-93. Potassium input through litter production in Q. mongolica community. 193
Fig. 2-94. Potassium input through litter production in Q. vaiabilis community. 194
Fig. 2-95. Potassium input through litter production in P. densiflora community. 194
Fig. 2-96. Calcium input through litter production in Q. mongolica community. 195
Fig. 2-97. Calcium input through litter production in Q. vaiabilis community. 195
Fig. 2-98. Calcium input through litter production in P. densiflora community. 196
Fig. 2-99. Magnesium input through litter production in Q. mongolica community. 196
Fig. 2-100. Magnesium input through litter production in Q. vaiabilis community. 197
Fig. 2-101. Magnesium input through litter production in P. densiflora community. 197
Fig. 2-102. Litter decomposition rate in Mt. Wolak. 199
Fig. 2-103. Changes of soil organic matter content along with the community. 200
Fig. 2-104. Changes of soil pH along with the community. 201
Fig. 2-105. Changes of soil ammonium content along with the community. 201
Fig. 2-106. Changes of soil nitrate content along with the community. 202
Fig. 2-107. Changes of soil Total nitrogen content along with the community. 202
Fig. 2-108. Changes of soil total phosphorus content along with the community. 203
Fig. 2-109. Changes of soil potassium content along with the community. 203
Fig. 2-110. Changes of soil calcium content along with the community. 204
Fig. 2-111. Changes of soil magnesium content along with the community. 204
Fig. 2-112. Monthly changes of soil pH in forest community. 212
Fig. 2-113. Changes of pH along with soil depth(Sept. 2006). 213
Fig. 2-114. Monthly changes of soil organic matter content. 213
Fig. 2-115. Changes of organic matter content(%) along with soil depth(Sept. 2006). 214
Fig. 2-116. Monthly changes of total nitrogen content(%) of soil. 214
Fig. 2-117. Monthly changes of total nitrogen content(%) along with soil depth(Sept. 2006). 215
Fig. 2-118. Monthly changes of inorganic content. 215
Fig. 2-119. Monthly changes of inorganic nitrogen content(mg/kg) along with soil depth(Sept. 2006). 216
Fig. 2-120. Monthly changes of total phosphorus content(mg/kg) along with soil depth. 216
Fig. 2-121. Changes of total phosphorus content(mg/kg) along with soil depth(Sept. 2006). 217
Fig. 2-122. Monthly changes of cation ions content. 218
Fig. 2-123. Changes of cation content(mg/kg) along with soil depth(Sept. 2006). 219
Fig. 2-124. Monthly changes of litter production. 220
Fig. 2-125. Monthly changes of total nitrogen in litter. 221
Fig. 2-126. Monthly changes of total phosphorus in litter. 221
Fig. 2-127. Monthly changes of cation content(mg/kg) in litter. 222
Fig. 2-128. Monthly changes of water content(%) and remaining ratio. 222
Fig. 2-129. Monthly changes of total-nitrogen in litter. 223
Fig. 2-130. Monthly changes of total-phosphorus in litter. 223
Fig. 2-131. Monthly changes of cation content(mg/kg) in litter. 224
Fig. 2-132. Annual changes of variation breath between daily max. and min. temperatures from June 2 to Dec 22 on the northern slope of Mt. Jumbong. 239
Fig. 2-133. Annual changes of variation breath between daily max. and min. temperatures from June 2 to Dec 22 on the southern slope of Mt. Jumbong. 240
Fig. 2-134. Changes of daily max. temperature on the southern and the northern slopes of Mt. Wolak during April and May, 2006. 250
Fig. 2-135. Changes of daily min. temperature on the southern and the northern slopes of Mt. Wolak during April and May, 2006. 251
Fig. 2-136. Changes of daily mean temperature on the southern and the northern slopes of Mt. Wolak during April and May, 2006. 251
Fig. 2-137. Changes of breath between max. and min. temperatures from June 18, 2005 to June 11, 2006. 252
Fig. 2-138. Photos of study areas for the National-Long Term Ecological Research in Korea. 271
Fig. 2-139. A light trap setup includes a containment bucket ( a killing agent optional for unattached sampling), funnel, plastic veins holding the UV lightbulb, top fastened down with bungee cords, and electrical wires equipped with a... 272
Fig. 2-140. Total abundance of 5 moth families (Pyralidae, Noctuidae, Arctiidae, Geometridae, Notodontidae) from the two forest types, Quercus mongolica and Pinus densiflora, from all the KNLTER areas (Mt. Nam, Mt. Jiri, Mt. Wolak, Mt. Jumbong) in 2005 and 2006. 276
Fig. 2-141. Total seasonal change of moths abundance from the two forest types, Quercus mongolica and pinus densiflora, in all the KNLTER areas (Mt. Nam, Mt. Jiri, Mt. Wolak, Mt. Jumbong) in 2005 and 2006. A Quercus mongolica forest (2005), B. Quercus... 277
Fig. 2-142. Means and standard errors of Shannon's diversity index from moth abundance collected at all the forest types in the KNLTER sites (Mts. Nam, Wolak, Jiri, and Jumbong) in 2005 and 2006. 278
Fig. 2-143. Non-metric Multidimensional Scaling with moth community data and environmental variables (soil pH, Mg, K, Ca, Shannon's diversity) from the KNLTER study areas in 2005 (Final stress: 11.95, Final instability: 0.00001, iteration... 279
Fig. 2-144. Non-metric Multidimensional scaling with moth community data from the KNLTER study areas (soil pH, Mg, K, Ca, shannon's diversity) in 2005 and 2006 (Final stress: 17.304, Final instability: 0.00003, Iteration: 79).... 280
Fig. 2-145. Study sites on Mt. Jiri. 283
Fig. 2-146. Study area A on Mt. Worak. 284
Fig. 2-147. Study area B on Mt. Worak. 285
Fig. 2-148. Study area C on Mt. Worak. 286
Fig. 2-149. Annual number of bird populations and species. 295
Fig. 2-150. Changes of number of observed bird populations at study area. 297
Fig. 2-151. Relationships between coverage percentage of dwarf bamboo and density of ground nesting bird per 10min. 303
Fig. 2-152. Density of breeding birds in 2005 and 2006. 303
Fig. 2-153. The mean (±SE) size of clutches produced by Parus varius at Piagol (a.s.l. 300m), Siamjae (a.s.l. 900m), Nogodan (a.s.l. 1400m) in the Mt. Jirisan. 305
Fig. 2-154. Period of clutch formation. 306
Fig. 2-155. Seasonal abundances of small mammals (Pine forest: elevation 400m). 307
Fig. 2-156. Seasonal abundances of small mammals (Oak forest: elevation 900m). 308
Fig. 2-157. Seasonal abundances of small mammals (Korean Fir forest: elevation 1,300m). 308
Fig. 2-158. Seasonal abundances of small mammals (Oak forest: elevation 1,400m). 309
Fig. 2-159. Species diversity of small mammals along elevation. 309
Fig. 2-160. Relationship between capture numbers and coverage of dwarf bamboo in May 2005.... 311
Fig. 2-161. Relationship between capture numbers and coverage of herbs in May 2005.... 312
Fig. 2-162. Relationship between capture numbers and coverage of rocks in May 2005.... 312
Fig. 2-163. Relationship between capture numbers and coverage of rocks in June 2006.... 313
Fig. 2-164. Relationship between capture numbers and coverage of herbs in June 2006.... 313
Fig. 2-165. Relationship between capture numbers and coverage of rocks in August 2006.... 314
Fig. 2-166. Monitoring sites selected for amphibians and reptiles in Woraksan National Park during 2005-2006 years. 317
Fig. 2-167. Species and number of reptile individuals confirmed at a specific monitoring site. 323
Fig. 2-168. Change of the species diversity indices of reptile community in Woraksan National park during 2005-2006 years. 324
Fig. 2-169. Typical habitats of Karsenia koreana (a, b) and photographs of adult males confirmed in Woraksan National Park (c, d). 326
Fig. 2-170. Photographs of Elaphe schrenckii anomala confirmed during 05-06 monitoring in Woraksan National Park. 327
Fig. 2-171. PIT tagging for individual identification of reptiles; (a) PIT tag reader, (b) PIT tags and an injection syringe, (c) inserting a PIT tag, (d) implanted PIT tag. 328
Fig. 2-172. Study sites. Map on the left-hand side shows all the regions affected by the East coast fires in 2000, while the map on the right-hand side shows the permanent plots which is located in Samcheok. 332
Fig. 2-173. Three classes of vegetation cover at post-fire regenerating stands(from left-hand side, low, intermediate and high). 333
Fig. 2-174. Trap establishment at unburned plot. 339
Fig. 2-175. Trap establishment at T1 plot. 340
Fig. 2-176. Trap establishment at T3 plot. 340
Fig. 2-177. Soil sample collection. 342
Fig. 2-178. Modified Berlese funnel for extraction of soil microarthropods. 342
Fig. 2-179. Lysimeter scheme for the measurement of runoff and sediment production from three burned plots. 345
Fig. 2-180. Stand layer development at post-fire permanent plots. 353
Fig. 2-181. Stem diameter growth over time at post-fire stands. Number on the left of each box indicates median value. 373
Fig. 2-182. Aboveground, underground and total biomass at plots. 374
Fig. 2-183. Annual litter production of plant organs. 380
Fig. 2-184. Annual nutrient turnover through litters. 382
Fig. 2-185. Soil respiration with time. 382
Fig. 2-186. Number of lepidoptera species for each family in 2006. 397
Fig. 2-187. Seasonal change in number of species and individuals. 398
Fig. 2-188. Season change in number of species for each family. 399
Fig. 2-189. Seasonal change in number of species at permanent plots with differenct burn severity and regeneration. 400
Fig. 2-190. Forageing by laval stage Lepidoptera in May 2006. 401
Fig. 2-191. Forageing by laval stage Lepidoptera in June 2006. 402
Fig. 2-192. Forageing by laval stage Lepidoptera in August 2006. 403
Fig. 2-193. Forageing by laval stage Lepidoptera in September 2006. 404
Fig. 2-194. Comparison of number of species in Lepidopera in 2005 and 2006 405
Fig. 2-195. Monthly pattern of numbers in immature stage Lepidopera species in 2005 and 2006 406
Fig. 2-196. Total fauna composition of soil microarthropods(mciroarthropods) in higher taxonomic levels from the forest-fire research area, Gangwon, Samcheok from 2005 to 2006. 407
Fig. 2-197. Total abundance of soil microarthropods collected from sites with different burn severity from 2005 to 2006. In this graph, one species of collembola, Isotoma viridis with 666 individuals collected from T1 in Aug. 2005 was omitted in purpose. 408
Fig. 2-198. Total abundance of soil microarthropods collected from different sites from 2005 to 2006.... 409
Fig. 2-199. Total abundance of collembola and species number collected from sites with different burn severity from 2005 to 2006. 410
Fig. 2-200. Relationships between abundance of soil arthropods and organic matter from the sites with different burn severity. 412
Fig. 2-201. Relationships between abundance of soil arthropods and pH from the sites with different burn severity. 413
Fig. 2-202. Relationships between abundance of soil arthropods and moisture content from the sites with different burn severity. 413
Fig. 2-203. Rainfall events occurred from September 1, 2005 to October 31, 2006 416
Fig. 2-204. Relationships between runoff and vegetation cover at three experimental sites. 417
Fig. 2-205. Relationships between runoff and rainfall at three sites. 418
Fig. 2-206. Sediment production at three experimental sites. 419
Fig. 2-207. Relationship between sediment production and runoff rate, and relationship between sediment production and vegetation cover at three experimental sites. 419
Fig. 2-208. Annual nutrient loss by way of runoff. 420
Fig. 2-209. Relative anion loss (left) and cation loss (right) at three experimental sites. 421
Fig. 2-210. Yearly changes of soil pH in Mts. Nam and Gyebang. 428
Fig. 2-211. Yearly changes of soil water pH in Mts nam and Gyebang. 429
Fig. 2-212. A comparison of Al concentration of soil water between Mt. Nam and Mt. Gyebang. 429
Fig. 2-213. Relationship between concentrations of H+ and al in soil water. 430
Fig. 2-214. Yearly changes of annual mean SO₂ in Mts Nam and Gyebang. 431
Fig. 2-215. A comparison of NO2 concentration between Mt. Nam and Gyebang. 432
Fig. 2-216. Yearly changes of annual mean pH of rainfall in Mts. Nam and Gyebang. 433
Fig. 3-1. Change of water quality 1... 442
Fig. 3-2. Change of water quality in Mulgeum 2... 443
Fig. 3-3. Change of water quality in Jeokpo... 444
Fig. 3-4. Change of water quality in Waekwan... 445
Fig. 3-5. Individual number of phytoplankton in Waekwan 446
Fig. 3-6. Individual number of phytoplankton in Jeokpo 447
Fig. 3-7. Individual number of phytoplankton in Mulgem 448
Fig. 3-8. Species composition of phytoplankton in Waekwan 449
Fig. 3-9. Species composition of phytoplankton in Jeokpo 450
Fig. 3-10. Species composition of phytoplankton in Mulgeum 451
Fig. 3-11. Individual number of phytoplankton in Waekwan 452
Fig. 3-12. Individual number of phytoplankton in Jeokpo 453
Fig. 3-13. Individual number of phytoplankton in Mulgeum 454
Fig. 3-14. Species composition of fish in Nackdong River 455
Fig. 3-15. Relative abundance of fish in Nackdong River 457
Fig. 3-16. Ratio of exotic speceis in Nackdong River 458
Fig. 3-17. Species composition of fish in Mulgeum 464
Fig. 3-18. Species composition of fish in Jeokpo 465
Fig. 3-19. Species composition of fish in Waekwan 466
Fig. 3-20. Results of Costello method for food sources of Micropterus salmoides 470
Fig. 3-31. Dual isotopic composition of source materials and consumers in Mulgeum 471
Fig. 3-22. Dual isotopic composition of source materials and consumers in Waegwan 472
Fig. 3-23. Dual isotopic composition of source materials and consumers in Jeokpo. 473
Fig. 3-24. Dual isotopic composition of source materials and consumers in Chungsugol. 474
Fig. 3-25. Change of individual and species number of avian in study sites 484
Fig. 3-26. Change of individual and species number of avian in Mulgeum 486
Fig. 3-27. Habitats for avian in Mulgeum 487
Fig. 3-28. Change of individual and species number of avian in Hanam 488
Fig. 3-29. Habitat for avian in Hanam 488
Fig. 3-30. Change of individual and species number of avian in Jeokpo 489
Fig. 3-31. Habitat for avian in Jeokpo 490
Fig. 3-32. Annual species number in study sites 493
Fig. 3-33. Annual change of individual of zooplankton in Nackdong River.... 496
Fig. 3-34. Individual of zooplankton in Nackdong River(2004-2006).... 497
Fig. 3-35. Individual number of zooplankton in study sites.... 499
Fig. 3-36. Total zooplankton carbon biomass(μgC/L) in study sites.... 501
Fig. 3-37. Total zooplankton carbon biomass(μgC/L) in study sites(2004-2006년).... 502
Fig. 3-38. Total zooplankton filtering rates on phytoplankt on and bacteria size(ml L-1 D-1) 변화. 504
Fig. 3-39. Results of phenology in Nackdong River 505
Fig. 3-40. Particular case 506
Fig. 3-41. Decomposition of leaf litter 506
Fig. 3-42. Life form of plants in study sites 507
Fig. 3-43. Life period of plants in study sites 507
Fig. 3-44. Ratio of exotic species in study sites 508
Fig. 3-45. Penthorum chinense pursh 508
Fig. 3-46. River bed composition in Nackdong River 509
Fig. 3-47. River bed composition in Mulgeum(NMK) 510
Fig. 3-48. Species richness in each sites 511
Fig. 3-49. Species richness in Mulgem(NMK) 511
Fig. 3-50. Density of macroinverterbrate in Nackdong River 512
Fig. 3-51. Density of macroinverterbrate in Mulgeum(NMK) 512
Fig. 3-52. BMWP in Baenaecheon(stream) 516
Fig. 3-53. Study sites 518
Fig. 3-54. Result of SOM and clustering 518
Fig. 3-55. Result of SOM and clustering in Nackdong River 519
Fig. 3-56. Study sites of Han River 525
Fig. 3-57. Gapyeongcheon 526
Fig. 3-58. Dong River 527
Fig. 3-59. Water quality in Uiam Dam... 539
Fig. 3-60. Water quality in Han River... 542
Fig. 3-61. Water quality in Dong River... 543
Fig. 3-62. Water quality in Gapyeongcheon... 544
Fig. 3-63. Water quality in Uiam Dam... 545
Fig. 3-64. BOD/COD Ratio in study sites 546
Fig. 3-65. Species number of macroinverterbrate in Gapyeongcheion 553
Fig. 3-66. Individual number of macroinverterbrate in Gapyeongcheion 553
Fig. 3-67. Individual and species number of macroinverterbrate 557
Fig. 3-68. Individual and species number of macroinverterbrate Goduckdong 561
Fig. 3-69. Body length of Ephemera orientalis 561
Fig. 3-70. Relative abundance of fish in NumHan River 564
Fig. 3-71. Dominant species and subdominant species 564
Fig. 3-72. Relative abundance of fish in BukHan River 566
Fig. 3-73. Dominant species and subdominant species in study site 566
Fig. 3-74. Relative abundance of fish in Han River 569
Fig. 3-75. Dominant species and subdominant species in study site 569
Fig. 3-76. Length-Weight Relationship of Z. platypus 570
Fig. 3-77. Length-Weight Relationship of Z. koreanus 571
Fig. 3-78. Condition factor(K) of Z. platypus 572
Fig. 3-79. Condition factor(K) of Z. koreanus 573
Fig. 3-80. Gonadosomatic index(GSI) of Z. platypus 574
Fig. 3-81. Gonadosomatic index(GSI) of Z. koreanus 574
Fig. 3-82. Species and individual number of avian in Han River 575
Fig. 3-83. Distribution of avian in Han River 576
Fig. 3-84. Distribution of avian in each habitats(2005-2006) 577
Fig. 3-85. Distribution of avian in study site(2005-2006) 578
Fig. 3-86. Breeding of avian in study sites(2005-2006년) 578
Fig. 3-87. Distribution of avian in Jungrangcheon(2005-2007) 580
Fig. 3-88. Individual and species number of avian in Gapyeongcheon 581
Fig. 3-89. Distribution of avian in Gapyeongcheon 582
Fig. 3-90. Individual and species number of avian in each habitats(2005-2006) 582
Fig. 3-91. Distribution of avian in Gapyeongcheon 583
Fig. 3-92. Breeding of avian in Gapyeongcheon(2005-2006) 584
Fig. 3-93. Distribution of avian in Dong River 585
Fig. 3-94. Individual and species number of avian in each habitats 586
Fig. 3-95. Distribution of avian in Dong River 586
Fig. 3-96. Breeding of avian in Dong River(2005-2007) 587
Fig. 3-97. Life form of plants in study sites(2005-2006) 588
Fig. 3-98. Ratio of exotic plants in study sites(2005-2006) 589
Fig. 3-99. Particular species in Han River 589
Fig. 3-100. Vegetation map in Han River(2006) 591
Fig. 3-101. Vegetation map in Dong River(2006) 592
Fig. 3-102. Vegetation map in Gapyeongcheon(2006) 593
Fig. 3-103. Temperature and rainfall during the study period(2005-2006) 594
Fig. 3-104. Changes of height, density and dry weight on 3 species 595
Fig. 3-105. Comparative study of height, density and dry weight between 2005 and 2006 596
Fig. 3-106. Leaf litter processing 597
Fig. 3-107. Study sites in Woopo... 602
Fig. 3-108. Woopo 603
Fig. 3-109. Mokpo 603
Fig. 3-110. Sajipo(Sagipo) 603
Fig. 3-111. Topyeongcheon 603
Fig. 3-112. Water quality in Woopo Wetland 613
Fig. 3-113. Change of Chl-a in study sites 624
Fig. 3-114. Change of phytoplankton in study sites 624
Fig. 3-115. Species number of phytoplankton in study sites 625
Fig. 3-116. Diversity index and dominant index in study sites 625
Fig. 3-117. Species composition in study sites 626
Fig. 3-118. Species composition to the Class in wetland Woopo. 638
Fig. 3-119. Species composition to the Order in Woopo. 638
Fig. 3-120. Species composition to the Order in Mokpo. 639
Fig. 3-121. Species composition to the Order in Sajipo 639
Fig. 3-122. Species composition to the Order in Topyung stream 640
Fig. 3-123. Changes of seasonal collected nember of species and individuals in Woopo. 641
Fig. 3-124. Changes of seasonal collected nember of species and individuals in Mokpo. 641
Fig. 3-125. Changes of seasonal collected nember of species and individuals in Sajipo. 642
Fig. 3-126. Changes of seasonal collected nember of species and individuals in Topyung stream. 643
Fig. 3-127. Changes of individuals of Cercion calamorum calamorum and cloeon dipterum in Wetland Woopo. 646
Fig. 3-128. Changes of possession percentage to the body length of Cercion calamorum calamorum. 647
Fig. 3-129. Changes of possession percentage to the body length of Cloeon dipterum. 649
Fig. 3-130. Species composition of fish in Woopo Wetland 651
Fig. 3-131. Relative abundance of fish in Woopo Wetland 652
Fig. 3-132. Ratio of exotic species 653
Fig. 3-133. Annual change of species number in Woopo Wetland 654
Fig. 3-134. Species composition of fish in Woopo 656
Fig. 3-135. Species composition of fish in Mokpo 657
Fig. 3-136. Species composition of fish in Sajipo 658
Fig. 3-137. Change of fish in Woopo Wetland 658
Fig. 3-138. View of the Upo wetland. (Upo, Sajjipo, Mokpo, Jjokjibeol) 662
Fig. 3-139. Monthly changes of the number of species and individuals of the bird at the whole upo wetland from Dec. 2004 to Jan. 2007. 663
Fig. 3-140. Monthly change of the number of species and individuals of the bird at Upo from Dec. 2004-Jan. 2007. 664
Fig. 3-141. Monthly change of the number of species and individuals of the bird at Sajipo from Dec. 2004- Jan. 2007. 665
Fig. 3-142. Monthly change of the number of species and individuals of the birds at Mokpo from Dec. 2004- Jan. 2007. 665
Fig. 3-143. Monthly change of the number of species and individuals of the birds at Jjokjibeol from Dec. 2004- Jan. 2007. 666
Fig. 3-144. Monthly change of the number of species and individuals at Topeung-chunfrom Dec. 2004. Jan. 2007. 666
Fig. 3-145. Been Gooses on a barley field 667
Fig. 3-146. Comparision of the species diversity indices of the bird community at Upo wetland between the surveyed years. 667
Fig. 3-147. Yearly changes of the individual numbers of the target species during the survey in the Upo wetland : Cygnus cygnus, Platarea leucorodia, Anas falcata, Anas crecca, Anas platyrhynchos, Anser fabalis. 669
Fig. 3-148. Yearly changing pattern of the been goose by the regression analysis. 669
Fig. 3-149. Yearly changing pattern of the Spoonbill(Platalea leucorodia) at the Upo wetland. 670
Fig. 3-150. Regression analysis of the yearly change of the individual numbers of the mallard (Anas platyrhynchos)between surveyed years. 670
Fig. 3-151. Regression analysis on the yearly change of the individual numbers of the common teal(Anas crecca). 671
Fig. 3-152. Yearly changes of the waterbirds except Been goose and target species at the Upo wetland. 671
Fig. 3-153. Yearly changing pattern of the Falcated teal(Anas acuta) in the Upo wetland. 672
Fig. 3-154. Regression analysis of the Wooper swan(Cygnus cygnus) with the yearly change of the individual numbers. 672
Fig. 3-155. Yearly changes of the total individual numbers of the species the Family Ardeidae. 673
Fig. 3-156. Yearly changes on the total individual numbers of the Grey heron(Ardea cinerea). 674
Fig. 3-157. Yearly change of the individual numbers of the large egret(Egretta alba) and intermediate egret (Egretta intermedia) observed at the Upo Wetland. 674
Fig. 3-158. Roosting and feeding sites of the Been goose (Anser fabalis) at the Upo Wetland. 675
Fig. 3-159. Moving orientations of the been goose (Anser fabalis) from Upo wetland for feeding and resting during the 2005~ 2006 winter. 675
Fig. 3-160. Flying directions of the been goose(Anser fabalis) during the wintering at the Upo Wetland. 676
Fig. 3-161. Feeding points and flying distances from Upo wetland of the Been goose (Anser fabalis) 676
Fig. 3-162. Roosting and feeding points of the Wooper swan(Cygnus cygnus) during first year survey(2004-2005) winter at th Upo wetland. 677
Fig. 3-163. Roosting and feeding points of the Wooper swan during second year survey (2005-2006) at the Upo wetland, especially during the frozen time in witter. 677
Fig. 3-164. It shows a different scenary of the Upo wetland by the change of the water level. 678
Fig. 3-165. Roosting points of the Grey heron and egret species for wintering at th Upo wetland. 678
Fig. 3-166. Roosting and feeding points of the spoonbill(Platalea leucorodia) in 2004-2005 winter at the Upo wetland. 679
Fig. 3-167. Roosting and feeding points of the spoonbill(Platalea leucorodia) in 2004-2005 winter at the upo wetland. 679
Fig. 3-168. Roosting and moving pattern of the Falcated teal(Anas falcata) in 2004-2006 winter at the upo wetland. 680
Fig. 3-169. Fishing activity by resident people at Mokpo. 680
Fig. 3-170. Bubo bubo and a breeding place 680
Fig. 3-171. The birds of prey confirmed at the Upo wetland during the survey.... 681
Fig. 3-172. Pb and Cd contents in Woop Wetland 681
Fig. 3-173. Pb and Cd contents in sediment 682
Fig. 3-174. Change of Pb contents 683
Fig. 3-175. Pb and Cd contents in Salix(2005) 683
Fig. 3-176. Pb and Cd contents in stem of Salix 684
Fig. 3-177. Pb and Cd contents in herbaceous plant(n=5) (2005) 685
Fig. 3-178. Pb and Cd contents in herbaceous plant 685
Fig. 3-179. Pb and Cd contents in Zizania latifolia 686
Fig. 3-180. Pb contents in fish 687
Fig. 3-181. Pb and Cd contents in invertebrates 687
Fig. 3-182/3-181. Pb and Cd contents in aquatic insects 689
Fig. 3-183/3-182. Pb and Cd contents in terrestrial invertebrates 689
Fig. 4-1. A map showing the surveyed sites in Hampyeong bay 696
Fig. 4-2. Monthly changes of the temperature in the study area 701
Fig. 4-3. Monthly changes of the rainfall in the study area 701
Fig. 4-4. Changes of the relative humidity in the study area 702
Fig. 4-5. Daily changes of the wind speed in the study area 702
Fig. 4-6. Monthly changes of the water temperature in the study area 703
Fig. 4-7. Monthly changes of the electronic conductivity in the study area 703
Fig. 4-8. Monthly changes of the salinity in the study area 704
Fig. 4-9. Monthly changes of the dissolved oxygen in the study area 705
Fig. 4-10. Monthly changes of the pH in the study area 705
Fig. 4-11. Monthly changes of the COD in the study area 706
Fig. 4-12. Monthly changes of the NH4+-N in the study area 706
Fig. 4-13. Monthly changes of the T-N in the study area 707
Fig. 4-14. Monthly changes of the PO4-P in the study area 707
Fig. 4-15. Monthly changes of the T-P in the study area 708
Fig. 4-16. Soil moisture contents... 709
Fig. 4-17. pH... 709
Fig. 4-18. Soil salinity 709
Fig. 4-19. Soil electronic conductivity 709
Fig. 4-20. Soil organic matter 710
Fig. 4-21. Total organic carbon 710
Fig. 4-22. Soil available phosphorus 710
Fig. 4-23. Soil total nitrogen 710
Fig. 4-24. Soil moisture contents... 711
Fig. 4-25. pH... 711
Fig. 4-26. Soil salinity 712
Fig. 4-27. Soil electronic conductivity 712
Fig. 4-28. Soil organic matter 712
Fig. 4-29. Total organic carbon 712
Fig. 4-30. Soil available phosphorus 713
Fig. 4-31. Soil total nitrogen 713
Fig. 4-32. Soil moisture contents... 713
Fig. 4-33. pH... 713
Fig. 4-34. Soil salinity 714
Fig. 4-35. Soil electronic conductivity 714
Fig. 4-36. Soil organic matter... 714
Fig. 4-37. Total organic carbon... 714
Fig. 4-38. Soil available phosphorus... 715
Fig. 4-39. Soil total nitrogen... 715
Fig. 4-40. Vegetation maps of Songseokri.... 724
Fig. 4-41. Vegetation maps of Gaipri.... 724
Fig. 4-42. Vegetation maps of Hyeonhwari.... 725
Fig. 4-43. Germination percentage of the halophytes seeding during 3 years. 725
Fig. 4-44. Biomass of the halophytes grown under study area during 3 years. 727
Fig. 4-45. Seasonal changes of the shoot lengths of each halophytes grown under study area during 3 years. 727
Fig. 4-46. Seasonal changes of the root lengths of each halophytes grown under study area during 3 years. 728
Fig. 4-47. Seasonal changes in the taproot and upper lateral lower lengths each of halophytes grown under study area during 3 years. 728
Fig. 4-48. The change of distribution areas of halophytes communities. 729
Fig. 4-49. The comparison of species number of invertebrate animals in intertidal zone. 740
Fig. 4-50. Species number of each phylum of invertebrate animals in intertidal zone. 741
Fig. 4-51. Seasonal coverage change of Balanus albicostatus, Crassostrea gigas, Vignadula atrata 742
Fig. 4-52. Coverage change of balanus albicostatus, Crassostrea gigas, Vignadula atrata 742
Fig. 4-53. Seasonal coverage change of Balanus albicostatus, Crassostrea gigas, Vignadula atrata 743
Fig. 4-54. Seasonal coverage change of Ophlitaspongia sp. 744
Fig. 4-55. Monthly changing aspect of spicule size of Ophlitaspongia sp. 745
Fig. 4-56. Seasonal change in biomass of Enteromorpha crinita Nees at the Gayip-ri during study period 747
Fig. 4-57. Sequential stages of development of Enteromorpha crinita Nees at the Gayip-ri 747
Fig. 4-58. Frequency distribution of sediment grain size in Enteromorpha crinita meadows. 748
Fig. 4-59. Pictures showing the recruitment habitats of Enteromorpha crinita at the Gayip-ri 748
Fig. 4-60. seasonal change in density (B-B values)of Enteromorpha crinita Nees at the Gayip-ri during study period 749
Fig. 4-61. Algae flora on the rocky habitate at Sosuk-ri. 750
Fig. 4-62. Image of ASTER(2001. 04. 25) 762
Fig. 4-63. Waterline extracted for DEM 762
Fig. 4-64. DEM of tidal zone of Hampyoung Bay in 2000 763
Fig. 4-65. Image of NDVI of Gaip-ri 764
Fig. 4-66. Tasseled cap transforming image in Gaip-ri. 765
Fig. 4-67. Relationship between Chlorophyll-a and NDVI 766
Fig. 4-68. Relationship between Chlorophyll-a and tasseled cap(greenness) 766
Fig. 4-69. Changes of NDVI in Hamphyoung Bay 768
Fig. 4-70. Tasseled cap in Hampyoung Bay on 16 April 2001 769
Fig. 4-71. Tasseled cap in Hampyoung bay on 14 Feb. 2002 770
Fig. 4-72. Tasseled cap in Hampyoung bay on 24 April 2004 770
Fig. 4-73. Land cover classification map in Hampyoung Bay 772
Fig. 4-74. Temperature pattern map in Hampyoung Bay 773
Fig. 4-75. Temperature pattern map in Hampyoung Bay 774
Fig. 4-76. Temperature pattern map in Hampyoung Bay 775
Fig. 4-77. Mapping of elevation, shadiness and slope pattern in Hampyoung Bay 776
Fig. 4-78. Dominant species of benthic diatom (Feb. 2005) 777
Fig. 4-79. Dominant species of benthic diatom (March 2006) 778
Fig. 4-80. Dominant species of benthic diatom (Nov. 2006) 779
Fig. 5-1. Study site of the magpie population (Seoul National University campus, 32.27'n, 126.57'e) 783
Fig. 5-2. Nest access with cargo crane 784
Fig. 5-3. Measurement of eggs 784
Fig. 5-4. Molecular sexing with Griffiths method 785
Fig. 5-5. Summary of breeding uccess 787
Fig. 5-6. Analysis of main causes of breeding failure (1998-2006) 788
Fig. 5-7. Sampling sites of the magpie DNA 793
Fig. 5-8. Allele size frequencies of the 7 markers used 796
Fig. 5-9. Heterozygosities of the study sites 796
Fig. 5-10. Genetic differentiation and geographical similarity of the Korean magpie populations with 9 microsatellite markers.... 797
Fig. 5-11. Schematic diagram of the population fluctuation model of Scotinophara lurida 801
Fig. 5-12. Wintering sites of scotinophara lurida(A) and riptortus clavatus(B) 802
Fig. 5-13. Study site of Scotinophara lurida... 803
Fig. 5-14. Study sites of Riptortus clavatus... 803
Fig. 5-15. Host plants of Riptortus clavatus... 804
Fig. 5-16. Growth rate of Scotinophara lurida(eff - 5th instar). O was excluded in linear regression 805
Fig. 5-17. Growth curve of Scotinophara lurida larvae in each developmental steps and the model application to Weibull function 806
Fig. 5-18. Linear regression of growth rate of adult Scotinophara lurida 806
Fig. 5-19. Composition models of scotinophara lurida oviposition. temperature-dependant number of oviposition, age-specific oviposition rate, age-specific survival rate. 807
Fig. 5-20. Predicted model(-) and observed value(o) in occurrence ratio of each developmental steps. occurrence number was denoted as ratio divided by peak number. observation data was used in research 2000. 808
Fig. 5-21. Occurrence pattern of Scotinophara lurida (Dongbu-nahnong research rice paddyfiled, Dang-jin, Chungchungnamdo, 2006) 810
Fig. 5-22. Occurrence pattern of Riptortus clavatus in each host plan(Seok-mun tide Dmbankment, Dang-jin, Chungchungnamdo, 2006) 810
Fig. 5-23. Mean temperature of the study sites of Scotinophara lurida and Riptortus clavatus (2006). 811
〈부록〉국가장기생태연구 방법 850
Fig. 1. 1ha 영구방형구내 25개 20X20m 소방형구 번호. 853
Fig. 2. 점봉산내 대표 영구방형구(1ha 영구방형구)내 식생전경(2003년 10월 24일) 854
Fig. 3. 대표 영구방형구(1 ha 영구방형구)와 위성 영구방형구(0.04ha)의 분포도. 854
Fig. 4. 점봉산 영구방형구내 초본층 피도의 공간분포(2004년 8월). 862
Fig. 5. 점봉산 영구방형구내 초본층 종밀도(No./100㎡)의 공간분포(2004년 8월). 862
Fig. 6. 영구방형구내 토양수분함량의 공간분포(1997년 5월). 863
Fig. 7. 점봉산 영구방형구내 낙엽층 두께와 초봄 시기 종밀도 분포의 관계(2007년 5월). 864
Fig. 1. 영구방형구 내 교목의 번호 및 위치 869
Fig. 2. 완성된 회귀직선 871
Fig. 3. 현장에 설치한 litter trap. 872
Fig. 4. 완성된 Litterbag 873
Fig. 1. 조사지역 내의 양서류 개체수 변화 890
Fig. 1. Pitfall trap diagram 893
Fig. 1. 자동기상관측기의 설치 예: 점봉산 강선리 유역을 대상으로. 896
Fig. 2. 강우가 발생한 날에 대한 해발고도-강우량 간의 가상적인 선형화 귀식의 예 896
Fig. 3. 유량조사를 위한 유역출구점과 소배수구역출구점을 선정한 예: 점봉산 강선리 유역을 대상으로. 897
Fig. 4. 수위-유량 회귀식: 점봉산 강선리유역 출구점 조시지점을 대상으로. 898
Fig. 5. 자동수위관측기를 이용한 2004년 수위변동자료의 예: 점봉산 강선리유역 출구조사지점을 대상으로. 899
Fig. 6. 하천수위와 수위측정 인근토양의 토양수분의 관계: 점봉산 강선리 유역 출구조사지점을 대상으로. 899
Fig. 1. 담수어류 채집방법 924
Fig. 1. A 조사지역내 고정조사구 서식처 변화상(예시) 953
Fig. 1. GIS data model. 985
Fig. 2. The flow of grain size analysis 986
Fig. 3. The flow of water content analysis. 987
Fig. 4. The flow of chlorophyll-a analysis. 989
Fig. 1. 국가장기생태 GIS-DB 시스템 개념도 993
Fig. 2. GIS-DB 형태에 따른 분류 994
Fig. 3. GeoDataBase Format 994
Fig. 4. GeoDataBase를 통한 GIS-DB 구축 995
Fig. 5. Web-GIS 기반 시스템 구성도 995
Fig. 6. GIS-DB 주제도 구축(예) 996
Fig. 7. Modeling 기법을 이용한 주제도 작성(예) 996
Fig. 8. 영구방형구에서의 공간데이터 예 997
Fig. 9. 육상생태계 B/L Trap 설치 위치도(예) 998
Fig. 10. 담수생태계 조사지점 위치도(예) 998
I. 제목: 국가장기생태연구사업
II. 연구목적 및 필요성
지구온난화에 따른 기후변화로 인해 전 세계적으로 자연생태계가 교란되고 생물다양성의 감소가 예상되고 있으며, 국내 자연생태계의 경우에도 예외는 아니다. 따라서 기후변화나 환경오염에 따른 자연 생태계의 장기적인 변화를 예측하고 이에 적합한 생태계 관리 방안을 마련하는 것이 요구되고 있다. 본 국가장기생태연구사업은 국내 주요생태계의 구조와 기능을 장기간에 걸쳐 연구, 모니터링 하여 미래의 생태계 관리정책결정에 필요한 기초자료를 제공하기 위한 것이다.
III. 연구내용 및 범위
국가장기생태연구사업의 핵심 연구내용은 식생동태(천이), 1차생산과 영양염류 순환, 식물계절현상, 생태계 유형에 따른 동물 지표종 (조류, 곤충류, 어류, 연안 무척추동물)의 생태, 산불지역의 생태 등을 연구하고, 이들 연구결과를 저장, 관리할 수 있는 GIS-DB 시스템을 구축하는 일이다.
IV. 연구결과
향후 지속될 장기생태연구의 근간이 되는 연구항목 및 연구방법이 확립되었고, 연구결과를 관리할 수 있는 GIS-DB 시스템이 완성되었다. 또한 이들 연구결과를 홍보할 수 있는 홈페이지를 구축하였고 이를 GIS-DB 시스템과 연계하여 운영하고 있다. 생태계 유형별로 각 연구항목별 연구가 당초 계획에 따라 진행 중이다.
<육상생태계>
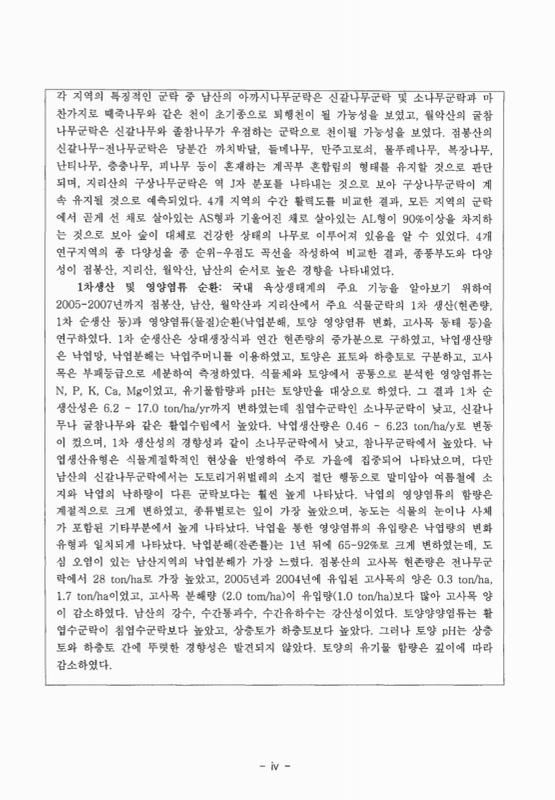
식생동태: 남산, 월악산, 점봉산 및 지리산의 4개 지역에서 각각 신갈나무림, 소나무림, 그리고 지역특성을 갖는 하나의 식생을 포함하는 세 개의 식생유형을 선정하여 식생동태를 모니터링하기 위해 영구방형구를 구축하였다. 영구방형구 설치 후 직경 2.5cm 이상의 목본식물에 라벨을 부착하고, 그들의 공간분포도를 작성하였다. 각 지역의 공통 식생인 신갈나무림 영구방형구에서 식생조성을 조사하여 지역 간에 비교하였다. 비교 결과 식생조성은 지역특성을 강하게 나타내었다. 주요 목본식물의 직경급별 빈도분포도를 작성하여 천이경향을 분석한 결과, 남산을 제외한 세지역의 신갈나무 군락은 지속적 유지가 가능할 것으로 판단되었지만, 남산의 신갈나무군락은 천이초기종인 팥배나무와 때죽나무가 우점하는 식생으로 대치되어 퇴행천이의 가능성을 보였다. 4개 지역 모두에서 소나무 군락은 다른 수종으로 대체 될 것으로 예상되었다. 남산을 제외한 세 지역은 정상적인 천이궤도를 거쳐, 지소의 잠재자연식생인 참나무류가 우점하는 군락으로 천이될 가능성을 보였지만, 남산의 것은 신갈나무군락과 마찬가지로 때죽나무와 같은 천이 초기종으로 퇴행천이 될 가능성을 보였다. 각 지역의 특징적인 군락 중 남산의 아까시나무군락은 신갈나무군락 및 소나무군락과 마찬가지로 때죽나무와 같은 천이 초기종으로 퇴행천이 될 가능성을 보였고, 월악산의 굴참나무군락은 신갈나무와 졸참나무가 우점하는 군락으로 천이될 가능성을 보였다. 점봉산의 신갈나무-전나무군락은 당분간 까치박달, 들메나무, 만주고로쇠, 물푸레나무, 복장나무, 난티나무, 층층나무, 피나무 등이 혼재하는 계곡부 혼합림의 형태를 유지할 것으로 판단되며, 지리산의 구상나무군락은 역 J자 분포를 나타내는 것으로 보아 구상나무군락이 계속 유지될 것으로 예측되었다. 4개 지역의 수간 활력도를 비교한 결과, 모든 지역의 군락에서 곧게 선 채로 살아있는 AS형과 기울어진 채로 살아있는 AL형이 90%이상을 차지하는 것으로 보아 숲이 대체로 건강한 상태의 나무로 이루어져 있음을 알 수 있었다. 4개 연구지역의 종 다양성을 종 순위-우점도 곡선을 작성하여 비교한 결과, 종풍부도와 다양성이 점봉산, 지리산, 월악산, 남산의 순서로 높은 경향을 나타내었다.
1차생산 및 영양염류 순환: 국내 육상생태계의 주요 기능을 알아보기 위하여 2005-2007년까지 점봉산, 남산, 월악산과 지리산에서 주요 식물군락의 1차 생산(현존량, 1차 순생산 등)과 영양염류(물질)순환(낙엽분해, 토양 영양염류 변화, 고사목 동태 등)을 연구하였다. 1차 순생산은 상대생장식과 연간 현존량의 증가분으로 구하였고, 낙엽생산량은 낙엽망, 낙엽분해는 낙엽주머니를 이용하였고, 토양은 표토와 하층토로 구분하고, 고사목은 부패등급으로 세분하여 측정하였다. 식물체와 토양에서 공통으로 분석한 영양염류는 N, P, K, Ca, Mg이었고, 유기물함량과 pH는 토양만을 대상으로 하였다. 그 결과 1차 순생산성은 6.2 - 17.0 ton/ha/yr까지 변하였는데 침엽수군락인 소나무군락이 낮고, 신갈나무나 굴참나무와 같은 활엽수림에서 높았다. 낙엽생산량은 0.46 - 6.23 ton/ha/y로 변동이 컸으며, 1차 생산성의 경향성과 같이 소나무군락에서 낮고, 참나무군락에서 높았다. 낙엽생산유형은 식물계절학적인 현상을 반영하여 주로 가을에 집중되어 나타났으며, 다만 남산의 신갈나무군락에서는 도토리거위벌레의 소지 절단 행동으로 말미암아 여름철에 소지와 낙엽의 낙하량이 다른 군락보다는 훨씬 높게 나타났다. 낙엽의 영양염류의 함량은 계절적으로 크게 변하였고, 종류별로는 잎이 가장 높았으며, 농도는 식물의 눈이나 사체가 포함된 기타부분에서 높게 나타났다. 낙엽을 통한 영양염류의 유입량은 낙엽량의 변화 유형과 일치되게 나타났다. 낙엽분해(잔존률)는 1년 뒤에 65-92%로 크게 변하였는데, 도심 오염이 있는 남산지역의 낙엽분해가 가장 느렸다. 점봉산의 고사목 현존량은 전나무군락에서 28 ton/ha로 가장 높았고, 2005년과 2004년에 유입된 고사목의 양은 0.3 ton/ha, 1.7 ton/ha이었고, 고사목 분해량 (2.0 tom/ha)이 유입량(1.0 ton/ha)보다 많아 고사목 양이 감소하였다. 남산의 강수, 수간통과수, 수간유하수는 강산성이었다. 토양양양염류는 활엽수군락이 침엽수군락보다 높았고, 상층토가 하층토보다 높았다. 그러나 토양 pH는 상층토와 하층토 간에 뚜렷한 경향성은 발견되지 않았다. 토양의 유기물 함량은 깊이에 따라 감소하였다.
식물계절현상: 기능의 변화에 가장 민감하게 나타나는 생명현상으로서 생물계절현상을 북부권을 대표하는 지소로 점봉산, 중부권에 속하는 월악산, 남부권에 속하는 지리산, 그리고 도시지역을 대표하는 지소로 남산을 선정, 조사하여 다음과 같은 결과를 얻었다. 본 연구는 동일한 지역에서 동일한 매목을 정하여 식물계절현상을 현장에서 확인하고 이를 기온의 상승과 결부시켜 해석함으로써 앞으로 지구의 온난화에 따른 생물 행동을 예측하는 것을 연구의 목표로 삼고 있다. 지역 간 차이는 북반구에서 생물의 행동이 위도 1˚, 고도 122 m, 경도 5˚ 증가에 따라 4일씩 늦어진다고 보고한 Hopkins(1920)의 기준에 토대를 두고 표준화하여 평가하였다.
곤충: 본 연구는 2005년 6월부터 9월까지, 2006년 5월, 6월, 8월, 9월에 남산의 신갈나무림(Quercus mongolica)과 소나무림(Pinus densiflora), 지리산의 신갈나무림, 소나무림 구상나무림 (Abies koreana), 월악산의 신갈나무림, 소나무림, 굴참나무림(Q. variabilis)에서, 2006년 6월과 8월엔 점봉산의 신갈나무림, 소나무림, 낙엽송림(Larix kaempferi)에서 UV 22Watt 트랩을 이용하여 나방을 포획하였고 식생 및 삼림의 주요 1차 소비자인 나방류의 종다양성을 시공간적으로 비교하였다. 본 연구기간동안 LTER 연구지에서 포획된 나방의 종수는 465종이었다. 포획된 나방의 수도는 월악산에서 가장 높았고, 지리산, 점봉산 그리고 남산 순이었으며, 본 연구에서 고려된 나방은 나방아목의 5개 과인, 불나방, 자나방, 밤나방, 재주나방과 명나방이었다. ANOVA는 종속변수를 수도로 이용 하였을 때, 샘플링한 날짜의 차이 (P < 0.05), 종속변수로 종풍부도를 이용 하였을 때는 날짜와 지역간에 통계학적으로 의미 있는 차이를 보여주었다 (P < 0.05). 다변량분석인 다차원분석법은 나방의 군집구조가 각 지역별로 뚜렷이 구분되어 나타났지만, 같은 지역내의 산림유형별 구분은 명확하지 않았으며 추후 지속될 연구를 통해 명확한 구분을 확정 지을 것으로 추정된다.
조류 및 포유류: 지구 온난화에 따른 급격한 기후변화로 인해 야생동물의 생태가 급격히 변화하고 있다. 종의 보전과 인류의 생존을 위해서도 이 같은 변화를 장기적으로 모니터링하여 급격한 변화에 대해 대응하는 자세가 필요하다. 그래서 본 연구에서는 야생동물 생태변화를 파악하기 위하여 조류와 포유류로 구분하여 한반도의 4지역(지리산, 점봉산, 월악산, 남산)을 대상으로 모니터링을 실시하였다. 각 지역별 조류상 조사 결과, 지리산에서는 2006년 5월 27종 134개체, 2006년 6월 조사에서는 총 28종 115개체의 조류가 관찰되었고, 이중 박새류(곤줄박이, 박새, 쇠박새, 진박새 등)가 우점하는 것으로 나타났다. 점봉산에서는 6목 15과 28종이 관찰 되었고, 여름철새 6종, 겨울철새 5종, 텃새 17종으로 나타났다. 월악산에서는 최대 12종(106개체)이 관찰 되었으며, 계절 별로 약간의 차이를 보였다. 남산에서는 29종의 조류가 관찰되었고, 지역별, 계절별, 임상수종별로 약간의 차이를 보였다. 조류상을 근거로 조류군집을 비교해 보면, 계절적으로는 봄이, 침엽수림보다 활엽수림에서 종다양성 지수가 더 높았다. 점봉산의 경우 영소길드별로 살펴보면, 나무구멍영소길드는 딱따구리류와 박새류를 포함하여 5종이 관찰되었고, 수관영소길드는 지빠귀류를 포함하여 3종, 지면영소길드는 솔새류를 포함하여 4종, 관목영소길드는 쇠유리새, 오목눈이 2종으로 나타났다. 관찰밀도 측면에서 지면을 둥지자원으로 이용하는 조류의 밀도가 높았다. 반면, 조릿대 피도율이 높아질수록 지면을 둥지자원으로 이용하는 조류의 밀도는 감소하였다.
고도에 따른 번식 생태의 차이를 비교해 본 결과, 알의 크기는 차이가 있다는 유의한 결과를 나타내지 않았지만, 한배 산란수와 첫 산란일은 고도에 따라 차이가 있는 결과를 나타내었다. 미소환경에 따른 소형포유류상의 변화를 살펴본 결과, 지리산의 경우, 소나무림에서의 종 풍부도가 봄에서 보다 가을에 감소하는 것으로 나타났으나, 신갈나무림, 구상나무림에서는 가을에 종풍부도가 증가하는 것으로 나타났다. 또한 고도에 따른 종풍부도는 고도가 높아짐에 따라 설치류의 종 풍부도가 감소하는 경향을 보였다. 점봉산의 경우, 2005년 5월에는 조릿대의 밀도가 증가할수록 대륙밭쥐의 밀도는 감소하였으나, 흰넓적다리붉은쥐의 밀도는 증가하였다. 초본층 피도량이 증가 할수록 흰넓적다리붉은쥐의 밀도는 감소하였으나 대륙밭쥐는 뚜렷한 경향을 보이지는 않았다. 바위의 피도량이 증가할수록 대륙밭쥐의 밀도는 증가하였으나 흰넓적다리붉은쥐는 뚜렷한 경향을 나타내지는 않았다. 2006년 6월에는 바위면적이 증가할수록 대륙밭쥐의 밀도가 증가하였으며, 초본층 피도량이 증가할 수록 흰넓적다리붉은쥐의 밀도는 감소하였다.
양서·파충류: 2005년도부터 2006년도까지 월악산국립공원의 모니터링 결과, 양서류의 경우, 대상종인 계곡산개구리, 무당개구리, 도롱뇽, 꼬리치레도롱뇽이 공원 내에서 안정된 군집을 이루어 서식하고 있음을 확인하였다. 반면, 북방산개구리의 경우 저지대에 위치하는 번식지의 훼손과 교란은 개체군의 수에 심각한 감소를 초래하는 것으로 나타났다. 파충류의 경우, 모니터링 대상종인 쇠살모사와 유혈목이의 경우, 안정적인 개체군을 유지하고 있는 반면에 아무르장지뱀, 살모사, 누룩뱀의 경우에는 2005년도에 비해 봄철 가뭄과 밝혀지지 않은 이유로 2006년도에는 개체수가 감소한 경향을 보였다. 이러한 파충류의 감소경향은 Pit tag를 이용한 장기적인 모니터링을 통해 그 원인을 찾을 수 있을 것으로 보인다. 전체적으로 2005년도와 비교해 2006년도에 양서, 파충류 종다양도와 종균등도에서 감소를 보이고 있었으며, 이러한 감소의 주된 요소는 2006년도 초의 봄철 가뭄과 몇몇 지역에서 수행된 서식지 및 번식지의 훼손과 교란 요인에 기인한 것으로 나타났다. 특별히 봄철에 수천마리의 북방산개구리의 번식지로 이용되는 당골 3번 세부조사지역의 매립과 논에 늦은 물대기는 북방산개구리의 해당년도 번식에 지대한 영향을 미치는 것으로 판단된다. 자료비교의 결과는 국립공원내의 저지대에 포함되는 농경지들의 경우 많은 동물들의 산란장소로 이용되고 있음을 고려할 때, 장기적인 측면에서는 이러한 지역들에 대한 보호 및 관리정책을 수립하여 관리하는 것이 공원 내 동물들의 보존에 중요하리라 사료된다. 본 조사로부터 2005-2006년도에 걸쳐서 국내에 유일한 폐가없는 도롱뇽과에 속하는 희귀종인 이끼도롱뇽의 서식이 확인되었으며, 2006년도에는 추가적인 서식지가 확인되어 공원 내에 폭넓은 분포가능성을 보여주었다 또한, 환경부의 멸종위기종으로 지정되어 있는 황구렁이의 포획, 관찰은 월악산국립공원지역이 멸종위기종의 관리지역으로서의 기능을 수행하고 있음을 보여주는 결과이다. 이러한 결과들은 월악산국립공원 내에서 동물들의 보존 정책을 수립하는 데 중요한 자료로 활용 가능할 것으로 생각된다.
산불지역: 2000년 동해안 산불피해지 중, 산불에 의한 피해정도 및 산불직후 재생정도가 다른 자연복원지역을 선정하여, 생태계 구성요소의 변화 양상을 구조 및 기능적 측면에서 모니터링하여, 장기적으로 산불이 빈발하는 동해안 지역에서의 산불 후 생태계 복원과정을 규명하는 것이 목적이다. 조사구의 식생은 산불 전 소나무림이었으며, 산불 직후 맹아 재생에 의해 초기 종조성이 결정된 후 종자 발아에 의해 서서히 종 수가 증가되고 있다. 종 조성은 신갈나무, 굴참나무 및 참싸리가 우점하는 활엽수림으로 발달하고 있다. 종수는 수관화 조사구가 지표화 조사구 보다, 그리고 재생피도가 높은 곳이 낮은 곳 보다 많았다. 수관화 피해 후 재생피도가 높은 T3 조사구는 2006년 아교목층까지 발달하였다. 현존 생물량은 미피해조사구 > 수관화 T3 > 지표화 > 수관화 T1 순이고, 토양영양염류는 수관화 조사구(T1, T3)가 낮고 지표화 조사구가 높았는데 낙엽 생산량의 경향도 유사했다. 질소 회수량은 수관화 지역(T1과 T3)이 미피해지역 보다 높았다. 토양호흡량은 산불피해정도가 심한 T1 조사구에서 낮았다. 나비/나방 중 2006년 밤나방과가 가장 우점하고 명나방과와 자나방과가 차우점하였다. 미피해 조사구의 종다양성이 가장 높았고 재생피도가 낮은 T1 조사구가 T3 조사구보다 많은 종이 출현했다. 유충채식은 참나무속에서 가장 활발하고 9월에 유충수가 가장 많았다. 토양 미소절지동물은 응애류 96%, 톡토기류가 23%를 차지하였다. 토양 동물 종수의 복원은 산불의 피해강도와는 반비례하고 재생피도에는 정비례하는 경향을 보이고 있으며, 수분함량, pH 및 유기물함량은 토양 미소절지동물 분포에 영향을 미치는 것으로 보인다. 산불피해사면에서 식생 피복률이 높을수록 강우의 지표 유출량이 줄었고 토양의 침식량은 크게 감소하였다. 동일하게 영양염류의 용탈도 식생의 재생피도가 가장 낮은 곳에서 가장 높게 나타났다. 피도가 높은 곳에서는 Ca++, Mg++, K+ 등 base cation의 용탈이 상대적으로 적은 나타난 반면, 낮은 곳에서는 이들 base cation 외에 인산의 용탈이 심했다. 결론적으로 산불지역에서 식생의 피복정도는 지표수의 유출에 절대적인 영향을 미치고 또한 침식에 크게 작용하는 것으로 나타났다.
<담수생태계>
국가장기생태연구사업 중 담수생태계 부분은 낙동강, 한강, 우포를 중심으로 2004년부터 2007년까지 진행되었다. 낙동강의 경우 물금, 적포, 고령, 한강의 경우 동강, 가평천, 한강하류, 우포의 경우 우포, 목포, 사지포를 중심으로 연구가 수행되었다. 주요연구항목은 기초수질의 변화, 1차생산자의 동태, 생물다양성(식물, 어류, 수서곤충, 조류, 동식물 플랑크톤)이었으며 연구분야에 따라 조사간격은 1주일에서 월별 등 다양하게 진행되었다. 낙동강의 경우 물금을 중심으로 한 조사기간내의 특별한 생태계 특성은 봄철 동물플랑크톤의 번성에 의한 식물플랑크톤의 급격한 감소를 관찰하였으며 이는 호수생태계에서 일반적으로 나타나는 청수현상과 유사하였다. 또한 조사기간 동안 지난 10년간에 비해 유량이 풍부하여 하계 식물플랑크톤의 대번성은 관찰되지 않았으며 겨울결빙현상도 거의 관찰되지 않았다. 수서곤충의 경우 우포와 같은 습지에서는 잠자리류가 지표종으로 선정되었으며, 낙동강에서는 오염정도가 상대적으로 높아 실지렁이류가 선정되었으며, 한강은 상류를 중심으로 하상구조가 타 지역과 다르고 수질이 양호하여 EPT 그룹을 지표종으로 선정하였다. 어류상의 경우 우포와 낙동강은 외래종번성(베스, 블루길)으로 전체적인 군집유사성이 높았으며, 한강은 이들 2지역보다 고유종의 비율이 높았다. 특히 우포의 경우 90년대말부터 외래종이 크게 번성하면서 고유종 중 크기가 작고 유영속도가 느린 버들붕어와 각시붕어들이 급격히 감소한 것으로 나타났다. 본류의 경우에도 치리와 끄리 같은 타수계에서 유입된 종들이 크게 번성하고 있어 외래종과 함께 이들 종에 대해서도 연구가 필요한 것으로 나타났다.
조류는 낙동강의 경우 일시적으로 이동하는 철새의 주요한 서식처로서 역할을 하는것으로 나타났으나 낙동강변 습지의 전반적인 감소와 서식처 질의 저하로 인한 것인지 장기적인 연구가 필요한 부분이다. 특히 낙동강하구를 찾는 고니류의 경우 하구의 먹이부족으로 인해서 1월초부터 주남저수지, 우포 및 낙동강 본류로 이동하는 것으로 나타나 국제적으로 중요한 종의 면밀한 서식분포 파악이 요구된다. 한강의 경우도 월동조류들은 지점별 중요성보다는 한강수계를 전체적으로 활용하므로 조류의 서식처보호를 위해서는 수변관리가 필요한 것으로 판단된다.
1단계 사업으로 생물다양성평가에 필요한 중요한 정보들이 축적되었으며 향후 지속적인 모니터링을 통하여 기후변화, 환경오염간의 관계가 파악될 것으로 사료된다.
<연안생태계>
연안생태계는 육상과 해양으로부터 풍부한 무기와 유기 영양염류가 공급되기 때문에 지구상에 존재하는 생태계 유형 중 생산성이 가장 높은 특징을 갖는 중요한 생태계이다. 최근 지구 온난화와 환경오염으로 인한 물리 환경적 요인 변화에 의하여 생물종 다양성과 생물량(저서규조류, 저서무척추동물, 해조류, 염생식물)에 급격한 변화가 발생하고 있다. 국가장기생태연구는 이러한 변화를 장기적으로 추적하여 연안 생태계의 구조와 기능을 규명하고 지구환경변화에 의한 연안생태계의 변화 모델과 관리전략을 구축하는 것이다. 국가장기생태 1단계 연구사업 결과, 연안생태계 장기모니터링을 위한 효율적 방법론이 확립되었으며, 안정된 기초 자료를 확보함으로써 장기 모니터링의 기초를 다져 놓은 점은 의미 있는 점이라 사료된다.
연안 생태계 중점 연구지소인 함평만에서 기후 데이터를 축적하고 수질과 토양분석을 통하여 물리 환경적 요인 변화를 측정하였다. 또한 저서규조류, 저서무척추동물, 해조류 및 염생식물 등의 다양성을 파악하고 환경변화에 민감한 지시종과 지표형질을 규명하였다. 위성영상과 지리정보를 활용하여 식생지수, 토지피복분류도, 온도분포도, 고도분포도, 음영기복도, 사면방향도 등을 작성하였다. 이러한 생물학적, 물리적 공간자료는 연안 생태계의 환경변화 양상을 모델링하고 우리나라의 통합연안관리시스템을 구축하는데 초석을 다졌다.
<동물생태분야>
동물생태 연구팀은 향후 동물개체군의 변화를 예측하고 적절한 관리 방안의 기준을 마련하는 것을 목표로, 장기적인 기후 변동이 동물 개체군의 변동에 미치는 영향과 한반도에 서식하는 동물종의 유전적 다양성을 평가하였다. 한반도 전역에 분포하며 기후 변화에 대한 반응을 통계적으로 예측할 수 있는 분류군인 까치와 노린재를 대상으로 1)기후 변동에 따른 까치의 번식 생태 변화를 양적인 측면과 질적인 측면으로 나누어 평가하고, 2)기온 상승으로 인한 노린재의 월등 및 번식 패턴을 모델링하며, 3)한반도 각 지역에 서식하는 까치의 유전적 분화도 및 다양성을 평가하였다.
그 결과 까치 번식 생태 분야에서는 특정 번식 시기의 기후 변동이 번식 성공도의 변화에 중요한 영향을 미치는 것으로 나타났고, 기온이 상승함에 따라 산란율과 성장률이 증가하는 것을 토대로 향후 곤충 발생률을 예측할 수 있는 온도 의존적 발생 모델을 제작할 수 있으며, 한반도에 서식하는 까치는 유전적 다양성이 매우 높으나 개체군간의 분화도는 높지 않은 것으로 평가되었다.
V. 연구결과의 활용계획
본 연구의 결과는 단기적으로는 국내 생태학의 발전에 기여하며, 장기간 누적·분석되어 국가의 미래 환경정책 결정을 위한 기초 자료로 활용될 수 있다.*표시는 필수 입력사항입니다.
| 전화번호 |
|---|
| 기사명 | 저자명 | 페이지 | 원문 | 기사목차 |
|---|
| 번호 | 발행일자 | 권호명 | 제본정보 | 자료실 | 원문 | 신청 페이지 |
|---|
도서위치안내: / 서가번호:

우편복사 목록담기를 완료하였습니다.
*표시는 필수 입력사항입니다.
저장 되었습니다.
